

96
2 Analytical Properties
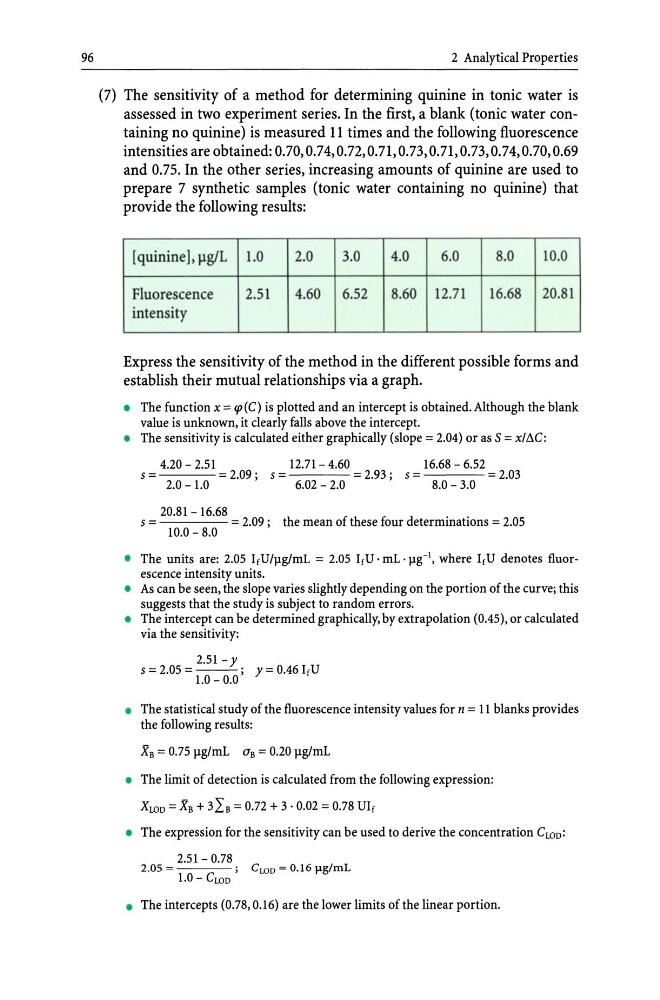
(7) The sensitivity of a method for determining quinine in tonic water is
assessed in two experiment series. In the first, a blank (tonic water containing no quinine) is measured 11 times and the following fluorescence
intensities are obtained: 0.70, 0.74, 0.72, 0.71, 0.73, 0.71, 0.73, 0.74,0.70,0.69
and 0.75. In the other series, increasing amounts of quinine are used to
prepare 7 synthetic samples (tonic water containing no quinine) that
provide the following results:
[quinine], llglL 1.0
2.0
3.0
4.0
6.0
8.0
10.0
Fluorescence
2.51
4.60 6.52
8.60 12.71
16.68 20.81
intensity
Express the sensitivity of the method in the different possible forms and
establish their mutual relationships via a graph.
• The function x == cp(C) is plotted and an intercept is obtained. Although the blank
value is unknown, it clearly falls above the intercept.
• The sensitivity is calculated either graphically (slope = 2.04) or as S = x//1C:
4.20 - 2.51
12.71 - 4.60
16.68 - 6.52
5 = = - - -
2.0 - 1.0
2.09; 5 ==
== 2.93; 5 = - - - -
6.02 - 2.0
8.0 - 3.0
2.03
20.81 - 16.68
5 ==
== 2.09; the mean of these four determinations == 2.05
10.0 - 8.0
• The units are: 2.05 IfU/}lg/mL == 2.05 IfU· mL · }lg-l, where IfU denotes fluorescence intensity units.
• As can be seen, the slope varies slightly depending on the portion of the curve; this
suggests that the study is subject to random errors.
• The intercept can be determined graphically, by extrapolation (0.45), or calculated
via the sensitivity:
2.51 - Y
5 == 2.05 = - - ; y == 0.46 IfU
1.0 - 0.0
• The statistical study of the fluorescence intensity values for n == 11 blanks provides
the following results:
XB == 0.7511g/mL aB == 0.20 llglmL
• The limit of detection is calculated from the following expression:
XWD == XB + 3 2:B == 0.72 + 3·0.02 == 0.78 UIf
• The expression for the sensitivity can be used to derive the concentration CWD :
2.51 - 0.78
2.05 =
; CLOD = 0.16 J.lg/mL
1.0 - CWD
• The intercepts (0.78,0.16) are the lower limits of the linear portion.
2 Analytical Properties
(7) The sensitivity of a method for determining quinine in tonic water is
assessed in two experiment series. In the first, a blank (tonic water containing no quinine) is measured 11 times and the following fluorescence
intensities are obtained: 0.70, 0.74, 0.72, 0.71, 0.73, 0.71, 0.73, 0.74,0.70,0.69
and 0.75. In the other series, increasing amounts of quinine are used to
prepare 7 synthetic samples (tonic water containing no quinine) that
provide the following results:
[quinine], llglL 1.0
2.0
3.0
4.0
6.0
8.0
10.0
Fluorescence
2.51
4.60 6.52
8.60 12.71
16.68 20.81
intensity
Express the sensitivity of the method in the different possible forms and
establish their mutual relationships via a graph.
• The function x == cp(C) is plotted and an intercept is obtained. Although the blank
value is unknown, it clearly falls above the intercept.
• The sensitivity is calculated either graphically (slope = 2.04) or as S = x//1C:
4.20 - 2.51
12.71 - 4.60
16.68 - 6.52
5 = = - - -
2.0 - 1.0
2.09; 5 ==
== 2.93; 5 = - - - -
6.02 - 2.0
8.0 - 3.0
2.03
20.81 - 16.68
5 ==
== 2.09; the mean of these four determinations == 2.05
10.0 - 8.0
• The units are: 2.05 IfU/}lg/mL == 2.05 IfU· mL · }lg-l, where IfU denotes fluorescence intensity units.
• As can be seen, the slope varies slightly depending on the portion of the curve; this
suggests that the study is subject to random errors.
• The intercept can be determined graphically, by extrapolation (0.45), or calculated
via the sensitivity:
2.51 - Y
5 == 2.05 = - - ; y == 0.46 IfU
1.0 - 0.0
• The statistical study of the fluorescence intensity values for n == 11 blanks provides
the following results:
XB == 0.7511g/mL aB == 0.20 llglmL
• The limit of detection is calculated from the following expression:
XWD == XB + 3 2:B == 0.72 + 3·0.02 == 0.78 UIf
• The expression for the sensitivity can be used to derive the concentration CWD :
2.51 - 0.78
2.05 =
; CLOD = 0.16 J.lg/mL
1.0 - CWD
• The intercepts (0.78,0.16) are the lower limits of the linear portion.