

414
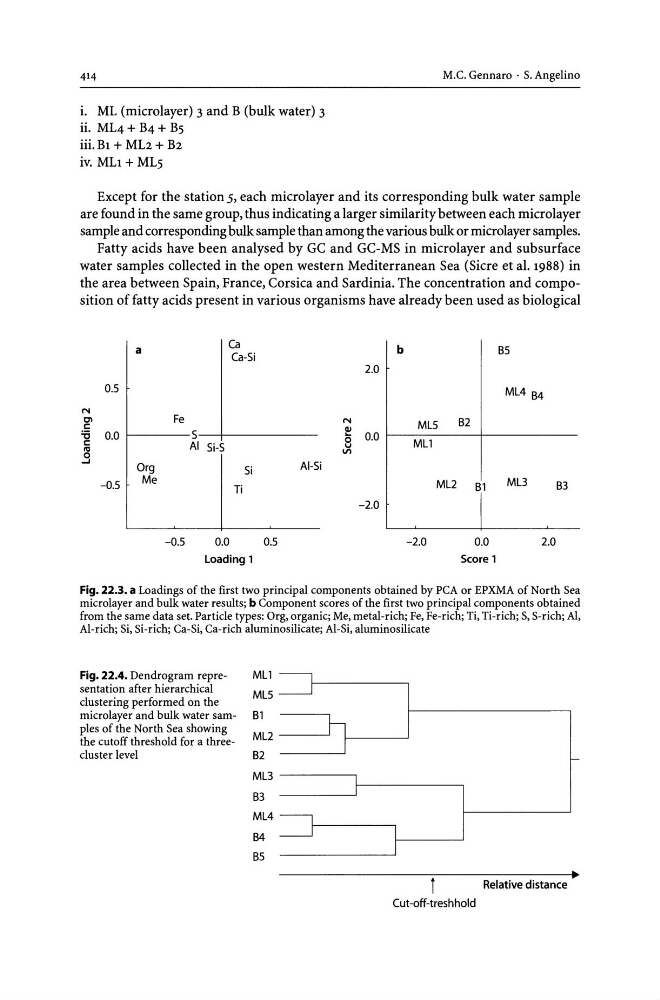
i. ML (microlayer) 3 and B (bulk water) 3
ii. ML4 + B4 + BS
iii. Bl + ML2 + B2
iv. MLI +MLS
M.C. Gennaro . S. Angelino
Except for the station 5, each microlayer and its corresponding bulk water sample
are found in the same group, thus indicating a larger similarity between each microlayer
sample and corresponding bulk sample than among the various bulk or microlayer samples.
Fatty acids have been analysed by GC and GC-MS in microlayer and subsurface
water samples collected in the open western Mediterranean Sea (Sicre et al. 1988) in
the area between Spain, France, Corsica and Sardinia. The concentration and composition of fatty acids present in various organisms have already been used as biological
a
Ca
b
Bs
Ca-Si
2.0
0.5
ML4 B4
N
CI
Fe
N
MLs
B2
c
!
'6 0.0
5
0.0
c
AI
0
MLl
Si-S
v
.9
VI
Org
Si
AI-Si
-0.5
Me
ML2
B1
ML3
B3
Ti
-2.0
-0.5
0.0
0.5
-2.0
0.0
2.0
Loading 1
Score 1
Fig. 22.3. a Loadings of the first two principal components obtained by PCA or EPXMA of North Sea
microlayer and bulk water results; b Component scores of the first two principal components obtained
from the same data set. Particle types: Org, organic; Me, metal-rich; Fe, Fe-rich; Ti, Ti-rich; S, S-rich; AI,
AI-rich; Si, Si-rich; Ca-Si, Ca-rich aluminosilicate; AI-Si, aluminosilicate
Fig. 22.4. Dendrogram representation after hierarchical
clustering performed on the
microlayer and bulk water samples of the North Sea showing
the cutoff threshold for a threecluster level
MLl
MLs
B1
ML2
B2
ML3
B3
ML4
B4
Bs
I
rI
I
Relative distance
Cut-off-treshhold
i. ML (microlayer) 3 and B (bulk water) 3
ii. ML4 + B4 + BS
iii. Bl + ML2 + B2
iv. MLI +MLS
M.C. Gennaro . S. Angelino
Except for the station 5, each microlayer and its corresponding bulk water sample
are found in the same group, thus indicating a larger similarity between each microlayer
sample and corresponding bulk sample than among the various bulk or microlayer samples.
Fatty acids have been analysed by GC and GC-MS in microlayer and subsurface
water samples collected in the open western Mediterranean Sea (Sicre et al. 1988) in
the area between Spain, France, Corsica and Sardinia. The concentration and composition of fatty acids present in various organisms have already been used as biological
a
Ca
b
Bs
Ca-Si
2.0
0.5
ML4 B4
N
CI
Fe
N
MLs
B2
c
!
'6 0.0
5
0.0
c
AI
0
MLl
Si-S
v
.9
VI
Org
Si
AI-Si
-0.5
Me
ML2
B1
ML3
B3
Ti
-2.0
-0.5
0.0
0.5
-2.0
0.0
2.0
Loading 1
Score 1
Fig. 22.3. a Loadings of the first two principal components obtained by PCA or EPXMA of North Sea
microlayer and bulk water results; b Component scores of the first two principal components obtained
from the same data set. Particle types: Org, organic; Me, metal-rich; Fe, Fe-rich; Ti, Ti-rich; S, S-rich; AI,
AI-rich; Si, Si-rich; Ca-Si, Ca-rich aluminosilicate; AI-Si, aluminosilicate
Fig. 22.4. Dendrogram representation after hierarchical
clustering performed on the
microlayer and bulk water samples of the North Sea showing
the cutoff threshold for a threecluster level
MLl
MLs
B1
ML2
B2
ML3
B3
ML4
B4
Bs
I
rI
I
Relative distance
Cut-off-treshhold