

M. Forina . S. Lanteri . R. Todeschini
due to the readability, very important with determinations close to the limit of quantization) to wavelet transforms, artificial neural networks, genetic algorithms, Kalman
filtering, trilinear decomposition, etc. However, some tools have fundamental importance, and they can be introduced and used without a deep knowledge of the underlying mathematics. Chemists must understand the performances of these ones. The tools
are equal to instruments with a lot of knobs: their settings must be selected with reference to the chemical problem and to the characteristics of chemical data.
The mathematical models obtained by the tools are soft models, without (or with
low) theoretical validity. Sometimes they can help in theoretical development, but generally their function is to solve practical problems.
The final goal of chemometrics is the prediction of quantities or of qualities. A
mathematical model for the prediction of a chemical quantity is a regression model;
in the case of a quality it is a class-modelling model. All models must be carefully tested
for their predictive ability, so that the result of the prediction can be given with a measure of its uncertainty. The techniques of predictive validation are a very important
characteristic of chemometrics.
21.2
The Fundamental Tools of Chemometries
21.2.1
Data Pretreatments (The Importance of Data Knowledge and of Problem)
An object is described by several variables, which are the result of the practical work
of the chemist. These variables can be homogeneous (e.g. concentrations in the same
unit), homogeneous and ordered (e.g. the absorbances at regularly spaced wavelengths) or non-homogeneous (e.g. concentration, time, temperature, absorbance).
Moreover, each variable is characterized by its noise.
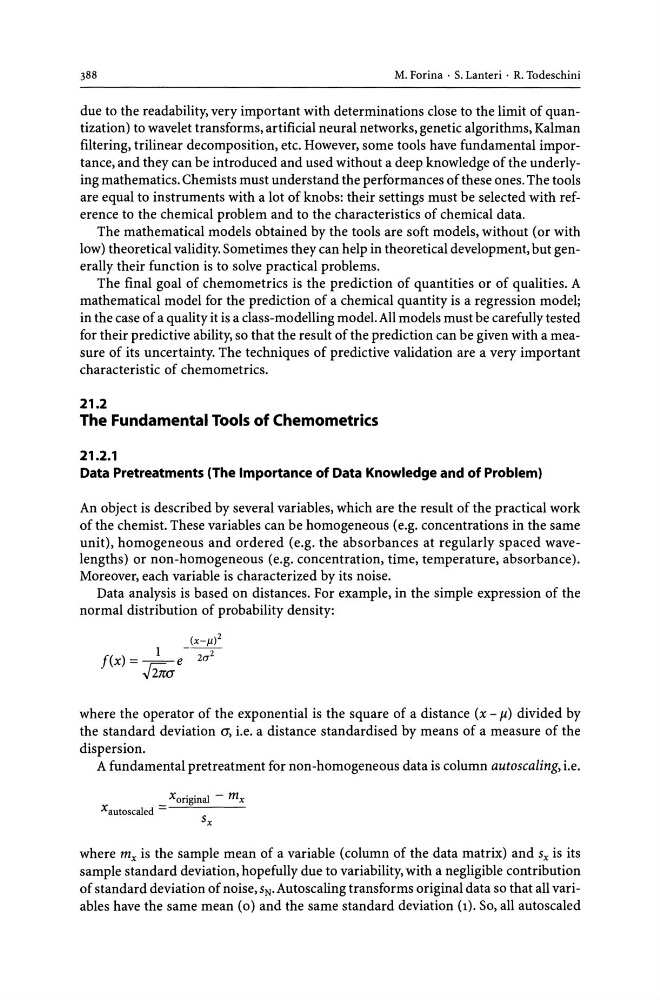
Data analysis is based on distances. For example, in the simple expression of the
normal distribution of probability density:
(X-JL)2
1
- - - 2 -
f(x) = - - e 20"
J2]iCT
where the operator of the exponential is the square of a distance (x - fl.) divided by
the standard deviation CT, i.e. a distance standardised by means of a measure of the
dispersion.
A fundamental pretreatment for non-homogeneous data is column autoscaling, i.e.
Xoriginal - mx
Xautoscaled =
Sx
where mx is the sample mean of a variable (column of the data matrix) and Sx is its
sample standard deviation, hopefully due to variability, with a negligible contribution
of standard deviation of noise,sN.Autoscaling transforms original data so that all variables have the same mean (0) and the same standard deviation (1). So, all autoscaled
due to the readability, very important with determinations close to the limit of quantization) to wavelet transforms, artificial neural networks, genetic algorithms, Kalman
filtering, trilinear decomposition, etc. However, some tools have fundamental importance, and they can be introduced and used without a deep knowledge of the underlying mathematics. Chemists must understand the performances of these ones. The tools
are equal to instruments with a lot of knobs: their settings must be selected with reference to the chemical problem and to the characteristics of chemical data.
The mathematical models obtained by the tools are soft models, without (or with
low) theoretical validity. Sometimes they can help in theoretical development, but generally their function is to solve practical problems.
The final goal of chemometrics is the prediction of quantities or of qualities. A
mathematical model for the prediction of a chemical quantity is a regression model;
in the case of a quality it is a class-modelling model. All models must be carefully tested
for their predictive ability, so that the result of the prediction can be given with a measure of its uncertainty. The techniques of predictive validation are a very important
characteristic of chemometrics.
21.2
The Fundamental Tools of Chemometries
21.2.1
Data Pretreatments (The Importance of Data Knowledge and of Problem)
An object is described by several variables, which are the result of the practical work
of the chemist. These variables can be homogeneous (e.g. concentrations in the same
unit), homogeneous and ordered (e.g. the absorbances at regularly spaced wavelengths) or non-homogeneous (e.g. concentration, time, temperature, absorbance).
Moreover, each variable is characterized by its noise.
Data analysis is based on distances. For example, in the simple expression of the
normal distribution of probability density:
(X-JL)2
1
- - - 2 -
f(x) = - - e 20"
J2]iCT
where the operator of the exponential is the square of a distance (x - fl.) divided by
the standard deviation CT, i.e. a distance standardised by means of a measure of the
dispersion.
A fundamental pretreatment for non-homogeneous data is column autoscaling, i.e.
Xoriginal - mx
Xautoscaled =
Sx
where mx is the sample mean of a variable (column of the data matrix) and Sx is its
sample standard deviation, hopefully due to variability, with a negligible contribution
of standard deviation of noise,sN.Autoscaling transforms original data so that all variables have the same mean (0) and the same standard deviation (1). So, all autoscaled