

CHAPTER 20 . Potentiometry for the Study of Acid-Base Properties of Sediments
In reality, by comparing the potentiometric data with the spectrometric ones, a good
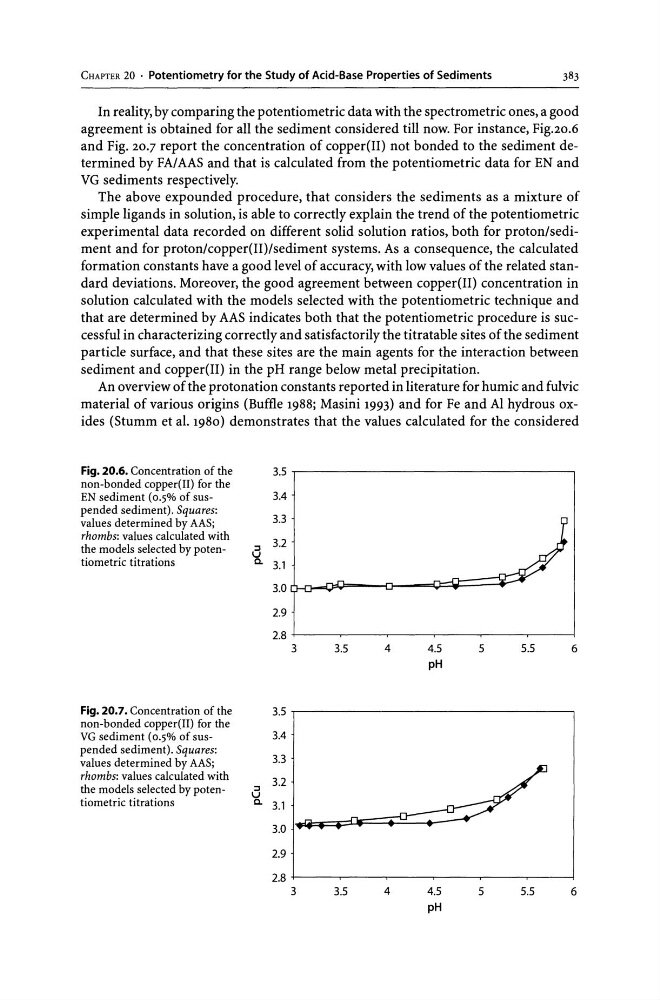
agreement is obtained for all the sediment considered till now. For instance, Fig.20.6
and Fig. 20.7 report the concentration of copper(II) not bonded to the sediment determined by FA/AAS and that is calculated from the potentiometric data for EN and
VG sediments respectively.
The above expounded procedure, that considers the sediments as a mixture of
simple ligands in solution, is able to correctly explain the trend of the potentiometric
experimental data recorded on different solid solution ratios, both for proton/sediment and for proton/copper(II)/sediment systems. As a consequence, the calculated
formation constants have a good level of accuracy, with low values of the related standard deviations. Moreover, the good agreement between copper(II) concentration in
solution calculated with the models selected with the potentiometric technique and
that are determined by AAS indicates both that the potentiometric procedure is successful in characterizing correctly and satisfactorily the titratable sites of the sediment
particle surface, and that these sites are the main agents for the interaction between
sediment and copper(II) in the pH range below metal precipitation.
An overview of the protonation constants reported in literature for humic and fulvic
material of various origins (Buffle 1988; Masini 1993) and for Fe and Al hydrous oxides (Stumm et al. 1980) demonstrates that the values calculated for the considered
Fig. 20.6. Concentration of the
3.5
non-bonded copper(II) for the
EN sediment (0.5% of sus3.4
pended sediment). Squares:
3.3
values determined by AAS;
rhombs: values calculated with
3.2
the models selected by poten:::J
u
tiometric titrations
Q, 3.1
3.0
2.9
2.8
3
3.5
4
4.5
5
5.5
6
pH
Fig. 20.7. Concentration of the
3.5
non-bonded copper(II) for the
VG sediment (0.5% of sus3.4
pended sediment). Squares:
3.3
values determined by AAS;
rhombs: values calculated with
3.2
the models selected by poten:::J
u
tiometric titrations
Q, 3.1
3.0
2.9
2.8
3
3.5
4
4.5
5
5.5
6
pH
In reality, by comparing the potentiometric data with the spectrometric ones, a good
agreement is obtained for all the sediment considered till now. For instance, Fig.20.6
and Fig. 20.7 report the concentration of copper(II) not bonded to the sediment determined by FA/AAS and that is calculated from the potentiometric data for EN and
VG sediments respectively.
The above expounded procedure, that considers the sediments as a mixture of
simple ligands in solution, is able to correctly explain the trend of the potentiometric
experimental data recorded on different solid solution ratios, both for proton/sediment and for proton/copper(II)/sediment systems. As a consequence, the calculated
formation constants have a good level of accuracy, with low values of the related standard deviations. Moreover, the good agreement between copper(II) concentration in
solution calculated with the models selected with the potentiometric technique and
that are determined by AAS indicates both that the potentiometric procedure is successful in characterizing correctly and satisfactorily the titratable sites of the sediment
particle surface, and that these sites are the main agents for the interaction between
sediment and copper(II) in the pH range below metal precipitation.
An overview of the protonation constants reported in literature for humic and fulvic
material of various origins (Buffle 1988; Masini 1993) and for Fe and Al hydrous oxides (Stumm et al. 1980) demonstrates that the values calculated for the considered
Fig. 20.6. Concentration of the
3.5
non-bonded copper(II) for the
EN sediment (0.5% of sus3.4
pended sediment). Squares:
3.3
values determined by AAS;
rhombs: values calculated with
3.2
the models selected by poten:::J
u
tiometric titrations
Q, 3.1
3.0
2.9
2.8
3
3.5
4
4.5
5
5.5
6
pH
Fig. 20.7. Concentration of the
3.5
non-bonded copper(II) for the
VG sediment (0.5% of sus3.4
pended sediment). Squares:
3.3
values determined by AAS;
rhombs: values calculated with
3.2
the models selected by poten:::J
u
tiometric titrations
Q, 3.1
3.0
2.9
2.8
3
3.5
4
4.5
5
5.5
6
pH