

CHAPTER 15 • Redox Processes of Chromium in Sea Water
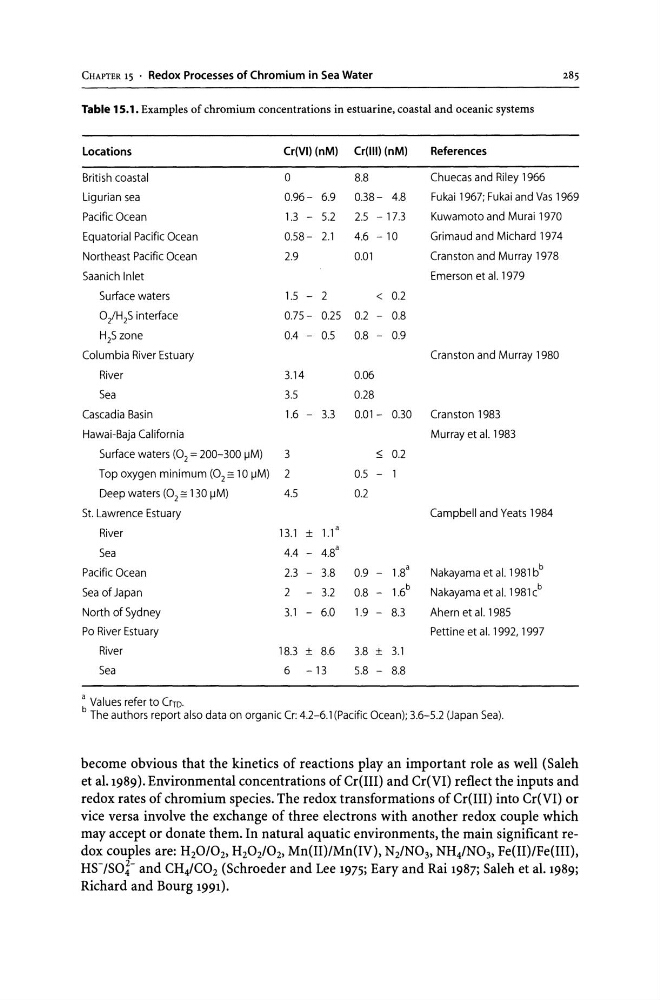
Table 15.1. Examples of chromium concentrations in estuarine, coastal and oceanic systems
Locations
Cr(VI) (nM) Cr(lll) (nM)
References
British coastal
0
8.8
Chuecas and Riley 1966
Ligurian sea
0.96- 6.9
0.38- 4.8
Fukai 1967; Fukai and Vas 1969
Pacific Ocean
1.3- 5.2
2.5 -17.3
Kuwamoto and Murai 1970
Equatorial Pacific Ocean
0.58- 2.1
4.6 -10
Grimaud and Michard 1974
Northeast Pacific Ocean
2.9
0.01
Cranston and Murray 1978
Saanich Inlet
Emerson et al. 1979
Surface waters
1.5 - 2
< 0.2
0/H 2 S interface
0.75- 0.25 0.2 - 0.8
H 2 S zone
0.4 - 0.5
0.8 - 0.9
Columbia River Estuary
Cranston and Murray 1980
River
3.14
0.06
Sea
3.5
0.28
Cascadia Basin
1.6 - 3.3 0.01- 0.30 Cranston 1983
Hawai-Baja California
Murray et al. 1983
Surface waters (02 = 200-300 ~M)
3
~ 0.2
Top oxygen minimum (02= 10 ~M) 2
0.5 -
Deep waters (02 = 130 ~M)
4.5
0.2
St. Lawrence Estuary
Campbell and Yeats 1984
River
13.1 ± 1.1 a
Sea
4.4 - 4.8 a
Pacific Ocean
2.3 - 3.8
0.9 - 1.8 a
Nakayama et al. 1981 bb
Sea of Japan
2 - 3.2
0.8 - 1.6 b
Nakayamaetal.1981c b
North of Sydney
3.1 - 6.0 1.9 - 8.3
Ahern et al. 1985
Po River Estuary
Pettine et al. 1992, 1997
River
18.3 ± 8.6
3.8 ± 3.1
Sea
6 -13
5.8 - 8.8
a Values referto CrTD.
b The authors report also data on organic Cr: 4.2-6.1 (Pacific Ocean); 3.6-5.2 (Japan Sea).
become obvious that the kinetics of reactions play an important role as well (Saleh
et al.1989). Environmental concentrations of Cr(III) and Cr(VI) reflect the inputs and
redox rates of chromium species. The redox transformations of Cr(III) into Cr(VI) or
vice versa involve the exchange of three electrons with another redox couple which
may accept or donate them. In natural aquatic environments, the main significant redox couples are: H 2 0I0 2 , H 2 0 2/0 2 , Mn(II)/Mn(IV), N 2 /N0 3 , NH 4 /N0 3 , Pe(II)/Pe(III),
HS-/SO~- and CH4/C02 (Schroeder and Lee 1975; Eary and Rai 1987; Saleh et al. 1989;
Richard and Bourg 1991).
Table 15.1. Examples of chromium concentrations in estuarine, coastal and oceanic systems
Locations
Cr(VI) (nM) Cr(lll) (nM)
References
British coastal
0
8.8
Chuecas and Riley 1966
Ligurian sea
0.96- 6.9
0.38- 4.8
Fukai 1967; Fukai and Vas 1969
Pacific Ocean
1.3- 5.2
2.5 -17.3
Kuwamoto and Murai 1970
Equatorial Pacific Ocean
0.58- 2.1
4.6 -10
Grimaud and Michard 1974
Northeast Pacific Ocean
2.9
0.01
Cranston and Murray 1978
Saanich Inlet
Emerson et al. 1979
Surface waters
1.5 - 2
< 0.2
0/H 2 S interface
0.75- 0.25 0.2 - 0.8
H 2 S zone
0.4 - 0.5
0.8 - 0.9
Columbia River Estuary
Cranston and Murray 1980
River
3.14
0.06
Sea
3.5
0.28
Cascadia Basin
1.6 - 3.3 0.01- 0.30 Cranston 1983
Hawai-Baja California
Murray et al. 1983
Surface waters (02 = 200-300 ~M)
3
~ 0.2
Top oxygen minimum (02= 10 ~M) 2
0.5 -
Deep waters (02 = 130 ~M)
4.5
0.2
St. Lawrence Estuary
Campbell and Yeats 1984
River
13.1 ± 1.1 a
Sea
4.4 - 4.8 a
Pacific Ocean
2.3 - 3.8
0.9 - 1.8 a
Nakayama et al. 1981 bb
Sea of Japan
2 - 3.2
0.8 - 1.6 b
Nakayamaetal.1981c b
North of Sydney
3.1 - 6.0 1.9 - 8.3
Ahern et al. 1985
Po River Estuary
Pettine et al. 1992, 1997
River
18.3 ± 8.6
3.8 ± 3.1
Sea
6 -13
5.8 - 8.8
a Values referto CrTD.
b The authors report also data on organic Cr: 4.2-6.1 (Pacific Ocean); 3.6-5.2 (Japan Sea).
become obvious that the kinetics of reactions play an important role as well (Saleh
et al.1989). Environmental concentrations of Cr(III) and Cr(VI) reflect the inputs and
redox rates of chromium species. The redox transformations of Cr(III) into Cr(VI) or
vice versa involve the exchange of three electrons with another redox couple which
may accept or donate them. In natural aquatic environments, the main significant redox couples are: H 2 0I0 2 , H 2 0 2/0 2 , Mn(II)/Mn(IV), N 2 /N0 3 , NH 4 /N0 3 , Pe(II)/Pe(III),
HS-/SO~- and CH4/C02 (Schroeder and Lee 1975; Eary and Rai 1987; Saleh et al. 1989;
Richard and Bourg 1991).