

210
R. Frache . P. Rivaro
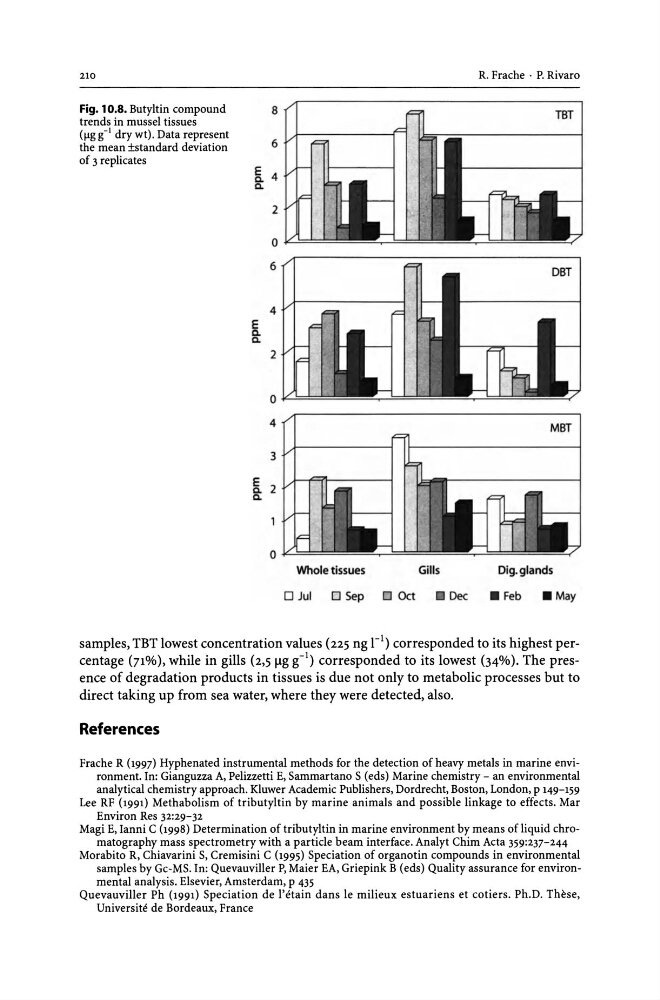
Fig. 10.8. Butyltin compound
8
trends in mussel tissues
(jigg-l dry wt). Data represent
6
the mean ±standard deviation
of 3 replicates
E
0. 4
0.
2
0
6
4
E
0.
0.
2
0
4
MBT
3
E
0. 2
0.
o~==
Whole tissues
Gills
Dig. glands
o Jul 0 Sep 0 Oct • Dec • Feb • May
samples, TBT lowest concentration values (225 ng rl) corresponded to its highest percentage (71%), while in gills (2,5jlg g-l) corresponded to its lowest (34%). The presence of degradation products in tissues is due not only to metabolic processes but to
direct taking up from sea water, where they were detected, also.
References
Frache R (1997) Hyphenated instrumental methods for the detection of heavy metals in marine environment.ln: Gianguzza A, Pelizzetti E, Sammartano S (eds) Marine chemistry - an environmental
analytical chemistry approach. Kluwer Academic Publishers, Dordrecht, Boston, London, p 149-159
Lee RF (1991) Methabolism of tributyltin by marine animals and possible linkage to effects. Mar
Environ Res 32:29-32
Magi E, Ianni C (1998) Determination of tributyltin in marine environment by means of liquid chromatography mass spectrometry with a particle beam interface. Analyt Chim Acta 359:237-244
Morabito R, Chiavarini S, Cremisini C (1995) Speciation of organotin compounds in environmental
samples by Gc-MS. In: Quevauviller P, Maier EA, Griepink B (eds) Quality assurance for environmental analysis. Elsevier, Amsterdam, p 435
Quevauviller Ph (1991) Speciation de l'etain dans Ie milieux estuariens et cotiers. Ph.D. These,
Universite de Bordeaux, France
R. Frache . P. Rivaro
Fig. 10.8. Butyltin compound
8
trends in mussel tissues
(jigg-l dry wt). Data represent
6
the mean ±standard deviation
of 3 replicates
E
0. 4
0.
2
0
6
4
E
0.
0.
2
0
4
MBT
3
E
0. 2
0.
o~==
Whole tissues
Gills
Dig. glands
o Jul 0 Sep 0 Oct • Dec • Feb • May
samples, TBT lowest concentration values (225 ng rl) corresponded to its highest percentage (71%), while in gills (2,5jlg g-l) corresponded to its lowest (34%). The presence of degradation products in tissues is due not only to metabolic processes but to
direct taking up from sea water, where they were detected, also.
References
Frache R (1997) Hyphenated instrumental methods for the detection of heavy metals in marine environment.ln: Gianguzza A, Pelizzetti E, Sammartano S (eds) Marine chemistry - an environmental
analytical chemistry approach. Kluwer Academic Publishers, Dordrecht, Boston, London, p 149-159
Lee RF (1991) Methabolism of tributyltin by marine animals and possible linkage to effects. Mar
Environ Res 32:29-32
Magi E, Ianni C (1998) Determination of tributyltin in marine environment by means of liquid chromatography mass spectrometry with a particle beam interface. Analyt Chim Acta 359:237-244
Morabito R, Chiavarini S, Cremisini C (1995) Speciation of organotin compounds in environmental
samples by Gc-MS. In: Quevauviller P, Maier EA, Griepink B (eds) Quality assurance for environmental analysis. Elsevier, Amsterdam, p 435
Quevauviller Ph (1991) Speciation de l'etain dans Ie milieux estuariens et cotiers. Ph.D. These,
Universite de Bordeaux, France