

CHAPTER 8 . Determination of Organic Complexation
50 ,------------------------------------------,
« E ...
40
c 30
!!!
::;
u
20
10
a
-0.8
60 b
« E ... 40
c
~
~
u
"" 20
III
&.
0
0
-0.7
5
10
15 20
Iron (nM)
-0.6
-0.5
-0.4
-0.3
Potential (V)
2.5 c
:::J
2
ClI
~
-.. 1.5
c
.g
~
:0
III
...J
0.5
0
25
0
2
4
6
8
Labile iron (nM)
0
0
10
12
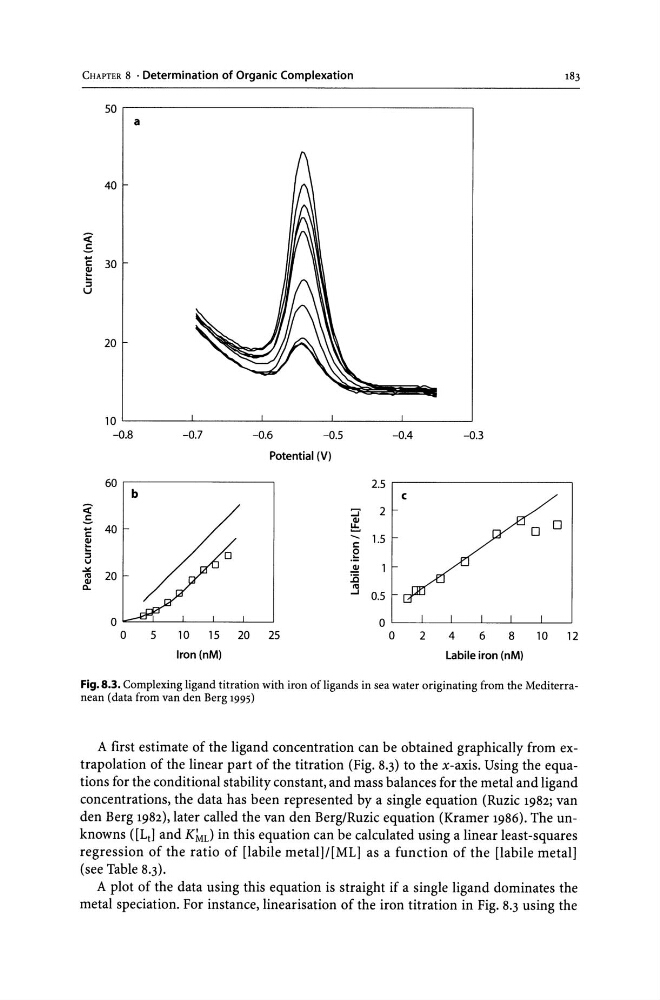
Fig. 8.3. Complexing ligand titration with iron of ligands in sea water originating from the Mediterranean (data from van den Berg 1995)
A first estimate of the ligand concentration can be obtained graphically from extrapolation of the linear part of the titration (Fig. 8.3) to the x-axis. Using the equations for the conditional stability constant, and mass balances for the metal and ligand
concentrations, the data has been represented by a single equation (Ruzic 1982; van
den Berg 1982), later called the van den Berg/Ruzic equation (Kramer 1986). The unknowns ([Lt ] and KMd in this equation can be calculated using a linear least-squares
regression of the ratio of [labile metal]/[ML] as a function of the [labile metal]
(see Table 8.3).
A plot of the data using this equation is straight if a single ligand dominates the
metal speciation. For instance, linearisation of the iron titration in Fig. 8.3 using the
50 ,------------------------------------------,
« E ...
40
c 30
!!!
::;
u
20
10
a
-0.8
60 b
« E ... 40
c
~
~
u
"" 20
III
&.
0
0
-0.7
5
10
15 20
Iron (nM)
-0.6
-0.5
-0.4
-0.3
Potential (V)
2.5 c
:::J
2
ClI
~
-.. 1.5
c
.g
~
:0
III
...J
0.5
0
25
0
2
4
6
8
Labile iron (nM)
0
0
10
12
Fig. 8.3. Complexing ligand titration with iron of ligands in sea water originating from the Mediterranean (data from van den Berg 1995)
A first estimate of the ligand concentration can be obtained graphically from extrapolation of the linear part of the titration (Fig. 8.3) to the x-axis. Using the equations for the conditional stability constant, and mass balances for the metal and ligand
concentrations, the data has been represented by a single equation (Ruzic 1982; van
den Berg 1982), later called the van den Berg/Ruzic equation (Kramer 1986). The unknowns ([Lt ] and KMd in this equation can be calculated using a linear least-squares
regression of the ratio of [labile metal]/[ML] as a function of the [labile metal]
(see Table 8.3).
A plot of the data using this equation is straight if a single ligand dominates the
metal speciation. For instance, linearisation of the iron titration in Fig. 8.3 using the