

CHAPTER 8 • Determination of Organic Complexation
181
Table 8.3. Theory of complexing ligand titrations using ligand competition with CSV
Calibration of a MAL by ligand competition against a known complex like EDTA:
EDTA is added to seawater containing the metal M and the competing ligand AL. The decrease in the
peak height is determined. The ratio (X) of the peak current for the metal in the presence Up) over that
in the absence U o ) of EDTA is given by (van den Berg, 1985):
X = ip / io = [MAL] / ([MAL] + [MEDTAJ)
This is equivalent to:
where the only unknown is a MAL
Values for a MAL are calculated from:
Data treatment of labile metal concentrations resulting from a ligand titration with metal ions. The
ratio of [labile metal] / [ML] is plotted as a function of the labile metal concentration. According to the
van den Berg/Ruzic equation (Ruzic 1982; van den Berg 1982) the data for a single ligand will lie on a
straight line:
[labile metal] / [ML] = [labile metal] / [L t ] + (aM + a MAL ) / ([Lt]K'ML)
where the concentrations of ML are calculated from [ML] = [Mt]-[Iabile metal].
Values for C[ and K'ML can be calculated from respectively the slope (= [Ltr 1 ) and the Y-axis intercept
(= (aM + a MAL ) / ([Lt]K'ML)) of a linear least squares regression of [labile metal] as a function of [labile
metal/ [ML] (Ruzic 1982; van den Berg 1982), or from a non-linear data treatment (e.g. van den Berg
1984a).
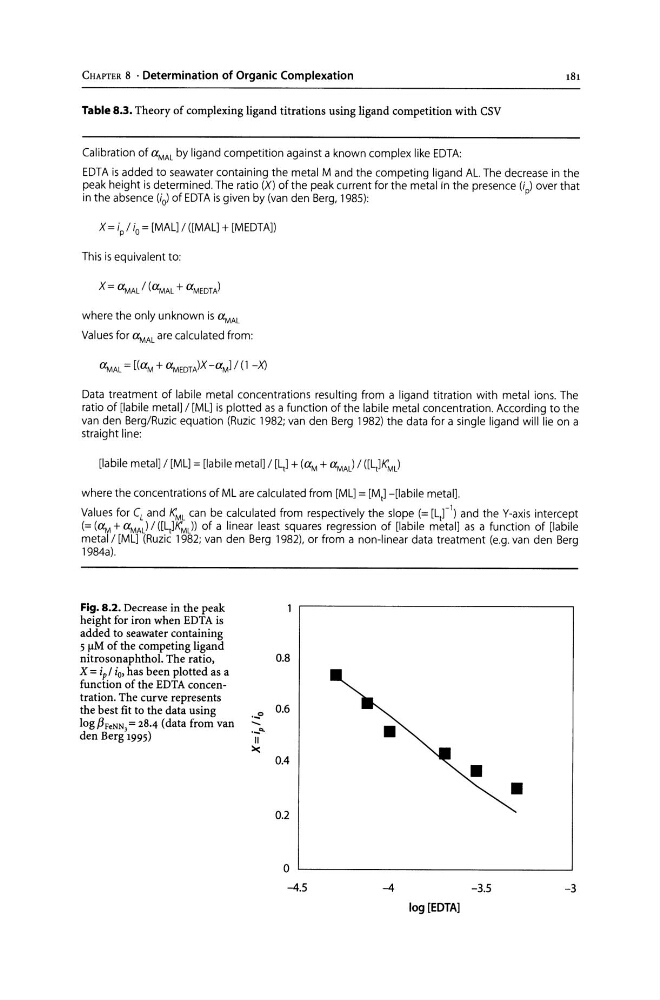
Fig. 8.2. Decrease in the peak
height for iron when EDTA is
added to seawater containing
5 flM of the competing ligand
nitrosonaphthol. The ratio,
X = ip! io, has been plotted as a
function of the EDTA concentration. The curve represents
the best fit to the data using
log f3FeNN, = 28.4 (data from van
den Berg 1995)
._0
._'"
II
)(
0.8
0.6
0.4
0.2
o
-4.5
-4
-3.5
-3
log [EDTA]
181
Table 8.3. Theory of complexing ligand titrations using ligand competition with CSV
Calibration of a MAL by ligand competition against a known complex like EDTA:
EDTA is added to seawater containing the metal M and the competing ligand AL. The decrease in the
peak height is determined. The ratio (X) of the peak current for the metal in the presence Up) over that
in the absence U o ) of EDTA is given by (van den Berg, 1985):
X = ip / io = [MAL] / ([MAL] + [MEDTAJ)
This is equivalent to:
where the only unknown is a MAL
Values for a MAL are calculated from:
Data treatment of labile metal concentrations resulting from a ligand titration with metal ions. The
ratio of [labile metal] / [ML] is plotted as a function of the labile metal concentration. According to the
van den Berg/Ruzic equation (Ruzic 1982; van den Berg 1982) the data for a single ligand will lie on a
straight line:
[labile metal] / [ML] = [labile metal] / [L t ] + (aM + a MAL ) / ([Lt]K'ML)
where the concentrations of ML are calculated from [ML] = [Mt]-[Iabile metal].
Values for C[ and K'ML can be calculated from respectively the slope (= [Ltr 1 ) and the Y-axis intercept
(= (aM + a MAL ) / ([Lt]K'ML)) of a linear least squares regression of [labile metal] as a function of [labile
metal/ [ML] (Ruzic 1982; van den Berg 1982), or from a non-linear data treatment (e.g. van den Berg
1984a).
Fig. 8.2. Decrease in the peak
height for iron when EDTA is
added to seawater containing
5 flM of the competing ligand
nitrosonaphthol. The ratio,
X = ip! io, has been plotted as a
function of the EDTA concentration. The curve represents
the best fit to the data using
log f3FeNN, = 28.4 (data from van
den Berg 1995)
._0
._'"
II
)(
0.8
0.6
0.4
0.2
o
-4.5
-4
-3.5
-3
log [EDTA]