

CHAPTER 2 . The Chemical and Physical Properties of Marine Aerosols: An Introduction
67
80
~ 30
1: 25 •
••
en
3- 20
t:
60-1-615
- flO
'"
III
E
~ 5
en
Co
3« 0
~ 40
- 1.5
- 1
- 0.5
0
0.5
~
Lamb's Rainfall Index
CI>
c
~
20
o 1'-1",-"1·,', .... ,-!
In
~
o
8;
In
......
'"
~
Sampling date
In
~
~
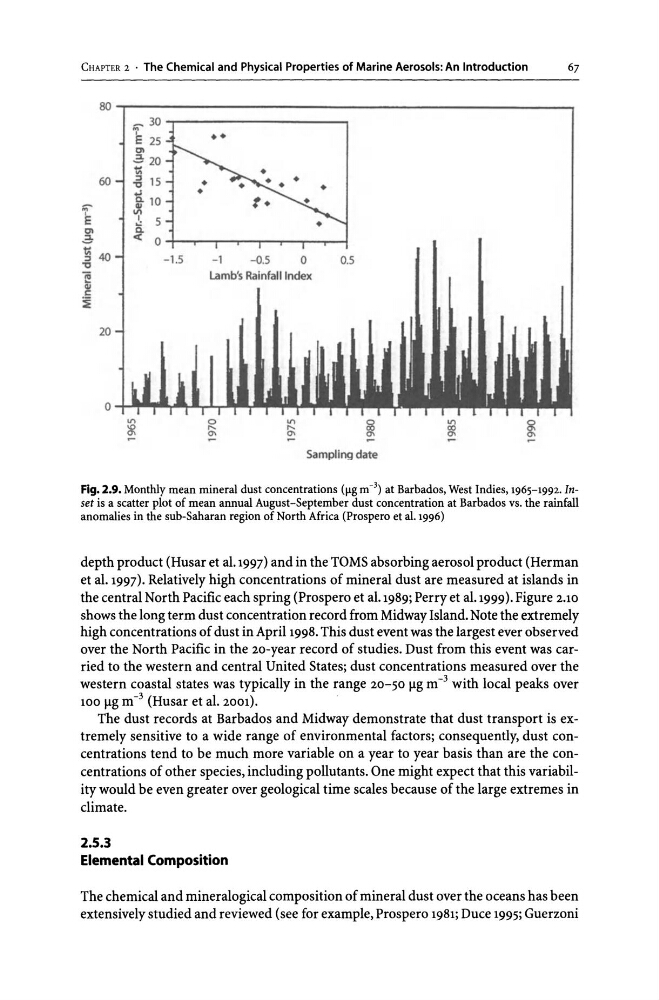
Fig. 2.9. Monthly mean mineral dust concentrations (Ilg m- 3 ) at Barbados, West Indies, 1965-1992. Inset is a scatter plot of mean annual August -September dust concentration at Barbados vs. the rainfall
anomalies in the sub-SalIaran region of North Africa (Prospero et al. 1996)
depth product (Husar et al.1997) and in the TOMS absorbing aerosol product (Herman
et al. 1997). Relatively high concentrations of mineral dust are measured at islands in
the central North Pacific each spring (Prospero et al.1989; Perry et al.1999). Figure 2.10
shows the long term dust concentration record from Midway Island. Note the extremely
high concentrations of dust in April 1998. This dust event was the largest ever observed
over the North Pacific in the 20-year record of studies. Dust from this event was carried to the western and central United States; dust concentrations measured over the
western coastal states was typically in the range 20-50 Ilg m -3 with local peaks over
100 Ilg m- 3 (Husar et al. 2001).
The dust records at Barbados and Midway demonstrate that dust transport is extremely sensitive to a wide range of environmental factors; consequently, dust concentrations tend to be much more variable on a year to year basis than are the concentrations of other species, including pollutants. One might expect that this variability would be even greater over geological time scales because of the large extremes in
climate.
2.5.3
Elemental Composition
The chemical and mineralogical composition of mineral dust over the oceans has been
extensively studied and reviewed (see for example, Prospero 1981; Duce 1995; Guerzoni
67
80
~ 30
1: 25 •
••
en
3- 20
t:
60-1-615
- flO
'"
III
E
~ 5
en
Co
3« 0
~ 40
- 1.5
- 1
- 0.5
0
0.5
~
Lamb's Rainfall Index
CI>
c
~
20
o 1'-1",-"1·,', .... ,-!
In
~
o
8;
In
......
'"
~
Sampling date
In
~
~
Fig. 2.9. Monthly mean mineral dust concentrations (Ilg m- 3 ) at Barbados, West Indies, 1965-1992. Inset is a scatter plot of mean annual August -September dust concentration at Barbados vs. the rainfall
anomalies in the sub-SalIaran region of North Africa (Prospero et al. 1996)
depth product (Husar et al.1997) and in the TOMS absorbing aerosol product (Herman
et al. 1997). Relatively high concentrations of mineral dust are measured at islands in
the central North Pacific each spring (Prospero et al.1989; Perry et al.1999). Figure 2.10
shows the long term dust concentration record from Midway Island. Note the extremely
high concentrations of dust in April 1998. This dust event was the largest ever observed
over the North Pacific in the 20-year record of studies. Dust from this event was carried to the western and central United States; dust concentrations measured over the
western coastal states was typically in the range 20-50 Ilg m -3 with local peaks over
100 Ilg m- 3 (Husar et al. 2001).
The dust records at Barbados and Midway demonstrate that dust transport is extremely sensitive to a wide range of environmental factors; consequently, dust concentrations tend to be much more variable on a year to year basis than are the concentrations of other species, including pollutants. One might expect that this variability would be even greater over geological time scales because of the large extremes in
climate.
2.5.3
Elemental Composition
The chemical and mineralogical composition of mineral dust over the oceans has been
extensively studied and reviewed (see for example, Prospero 1981; Duce 1995; Guerzoni