

CHAPTER 8 . Speciation of Metals in Natural Waters
207
for the mean activity coefficient for HCI in sea water. Emf measurements have been
made in artificial sea water with (Khoo et al. 1977a; Dickson 1990b; Campbell et al.1993)
and without S~- (Khoo et al. 1977a). The mean activity coefficient of HCI, ~(HCI) = ('lHYcl.5,
determined from the model has been shown to be in good agreement with the measured values (Campbell et al. 1993). The deviations are generally within 0.005, with the
exception of the 40°C data that is reproduced within ±0.01 units (Millero and Pierrot 1998).
The model yields reliable dissociation constants for the ionization of acids in sea
water from 0 to 50°C (Millero and Roy 1997). Comparisons of the measured and calculated pKs for a number of acids at 25°C are given in Table 8.4. The differences are
close to the experimental error of the measurements and demonstrate the reliability
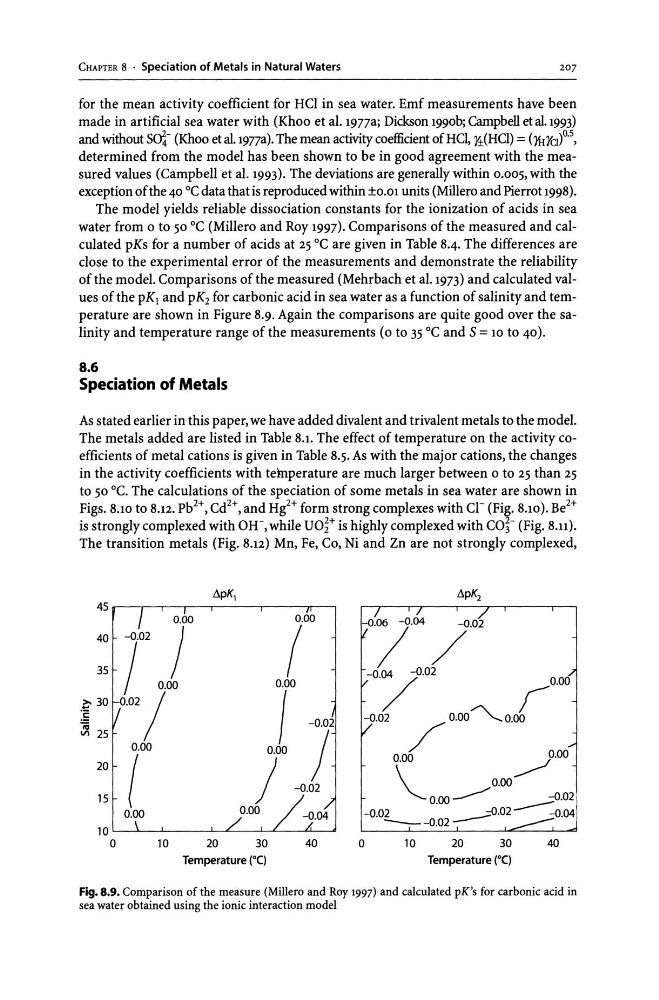
of the model. Comparisons of the measured (Mehrbach et al. 1973) and calculated values of the pKj and pK2 for carbonic acid in sea water as a function of salinity and temperature are shown in Figure 8.9. Again the comparisons are quite good over the salinity and temperature range of the measurements (0 to 35°C and S = 10 to 40).
8.6
Speciation of Metals
As stated earlier in this paper, we have added divalent and trivalent metals to the model.
The metals added are listed in Table 8.1. The effect of temperature on the activity coefficients of metal cations is given in Table 8.5. As with the major cations, the changes
in the activity coefficients with teinperature are much larger between 0 to 25 than 25
to 50°C. The calculations of the speciation of some metals in sea water are shown in
Figs. 8.10 to 8.12. Pb 2 +, Cd 2 +, and Hg2+ form strong complexes with cr (Fig. 8.10). Be 2 +
is strongly complexed with OW, while UO~+ is highly complexed with CO~- (Fig. 8.u).
The transition metals (Fig. 8.12) Mn, Fe, Co, Ni and Zn are not strongly complexed,
~pKl
~D
n
0.00
40 I- -0.02
)
351- )
0.00
f 301/0.02/
III 25 ~
0.00
(
20
15
0.00
r
T ~02
000
J
)
~.02
0.00
10'
"
£,
o
10
20
30
40
Temperature (OC)
~pK2
0 04
-0.02
0.06 -.
/
/
02
0.00
-0.
, -
-0.04/
/
o.oo~o.oo
-0.02
/
0.00
0.00
/
~
0.00
-002
~
.
0.00
-0.02 ---=0.04
--0.0~_0.02
o
10
20
30
40
Temperature (OC)
Fig. 8.9. Comparison of the measure (Millero and Roy 1997) and calculated pK's for carbonic acid in
sea water obtained using the ionic interaction model
207
for the mean activity coefficient for HCI in sea water. Emf measurements have been
made in artificial sea water with (Khoo et al. 1977a; Dickson 1990b; Campbell et al.1993)
and without S~- (Khoo et al. 1977a). The mean activity coefficient of HCI, ~(HCI) = ('lHYcl.5,
determined from the model has been shown to be in good agreement with the measured values (Campbell et al. 1993). The deviations are generally within 0.005, with the
exception of the 40°C data that is reproduced within ±0.01 units (Millero and Pierrot 1998).
The model yields reliable dissociation constants for the ionization of acids in sea
water from 0 to 50°C (Millero and Roy 1997). Comparisons of the measured and calculated pKs for a number of acids at 25°C are given in Table 8.4. The differences are
close to the experimental error of the measurements and demonstrate the reliability
of the model. Comparisons of the measured (Mehrbach et al. 1973) and calculated values of the pKj and pK2 for carbonic acid in sea water as a function of salinity and temperature are shown in Figure 8.9. Again the comparisons are quite good over the salinity and temperature range of the measurements (0 to 35°C and S = 10 to 40).
8.6
Speciation of Metals
As stated earlier in this paper, we have added divalent and trivalent metals to the model.
The metals added are listed in Table 8.1. The effect of temperature on the activity coefficients of metal cations is given in Table 8.5. As with the major cations, the changes
in the activity coefficients with teinperature are much larger between 0 to 25 than 25
to 50°C. The calculations of the speciation of some metals in sea water are shown in
Figs. 8.10 to 8.12. Pb 2 +, Cd 2 +, and Hg2+ form strong complexes with cr (Fig. 8.10). Be 2 +
is strongly complexed with OW, while UO~+ is highly complexed with CO~- (Fig. 8.u).
The transition metals (Fig. 8.12) Mn, Fe, Co, Ni and Zn are not strongly complexed,
~pKl
~D
n
0.00
40 I- -0.02
)
351- )
0.00
f 301/0.02/
III 25 ~
0.00
(
20
15
0.00
r
T ~02
000
J
)
~.02
0.00
10'
"
£,
o
10
20
30
40
Temperature (OC)
~pK2
0 04
-0.02
0.06 -.
/
/
02
0.00
-0.
, -
-0.04/
/
o.oo~o.oo
-0.02
/
0.00
0.00
/
~
0.00
-002
~
.
0.00
-0.02 ---=0.04
--0.0~_0.02
o
10
20
30
40
Temperature (OC)
Fig. 8.9. Comparison of the measure (Millero and Roy 1997) and calculated pK's for carbonic acid in
sea water obtained using the ionic interaction model