

276
9. Turbulent Flows
designed to deal with turbulence generated by shear which has a character
very different from that created by the oscillating grid.
------ Mellor-Yarnada
m. .
.
.
.
.
.
.
.
.
-3 -
Hanjalic-Launder, 1
-.-.-.- Hanjalic-Launder, 2
-4 -
DNS
-5 4
I
0.0
0.5
1 . O
1.5
2.0
2.5
3.0
3.5
Distance from grid
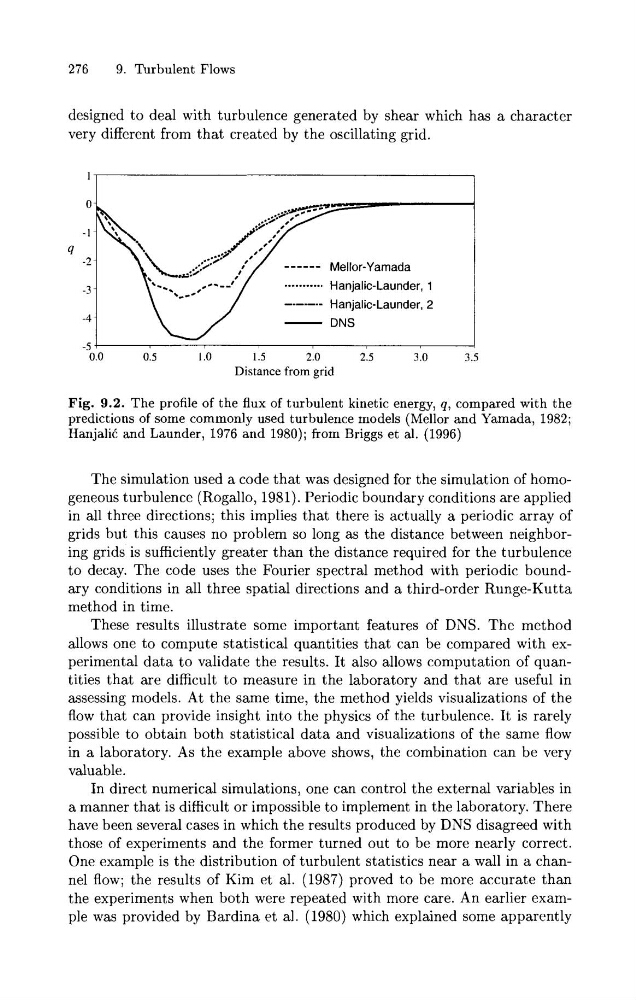
Fig. 9.2. The profile of the flux of turbulent kinetic energy, q, compared with the
predictions of some commonly used turbulence models (Mellor and Yamada, 1982;
HanjaliC and Launder, 1976 and 1980); from Briggs et al. (1996)
The simulation used a code that was designed for the simulation of homogeneous turbulence (Rogallo, 1981). Periodic boundary conditions are applied
in all three directions; this implies that there is actually a periodic array of
grids but this causes no problem so long as the distance between neighboring grids is sufficiently greater than the distance required for the turbulence
to decay. The code uses the Fourier spectral method with periodic boundary conditions in all three spatial directions and a third-order Runge-Kutta
method in time.
These results illustrate some important features of DNS. The method
allows one to compute statistical quantities that can be compared with experimental data t o validate the results. It also allows computation of quantities that are difficult t o measure in the laboratory and that are useful in
assessing models. At the same time, the method yields visualizations of the
flow that can provide insight into the physics of the turbulence. It is rarely
possible to obtain both statistical data and visualizations of the same flow
in a laboratory. As the example above shows, the combination can be very
valuable.
In direct numerical simulations, one can control the external variables in
a manner that is difficult or impossible to implement in the laboratory. There
have been several cases in which the results produced by DNS disagreed with
those of experiments and the former turned out to be more nearly correct.
One example is the distribution of turbulent statistics near a wall in a channel flow; the results of Kim et al. (1987) proved to be more accurate than
the experiments when both were repeated with more care. An earlier example was provided by Bardina et al. (1980) which explained some apparently
9. Turbulent Flows
designed to deal with turbulence generated by shear which has a character
very different from that created by the oscillating grid.
------ Mellor-Yarnada
m. .
.
.
.
.
.
.
.
.
-3 -
Hanjalic-Launder, 1
-.-.-.- Hanjalic-Launder, 2
-4 -
DNS
-5 4
I
0.0
0.5
1 . O
1.5
2.0
2.5
3.0
3.5
Distance from grid
Fig. 9.2. The profile of the flux of turbulent kinetic energy, q, compared with the
predictions of some commonly used turbulence models (Mellor and Yamada, 1982;
HanjaliC and Launder, 1976 and 1980); from Briggs et al. (1996)
The simulation used a code that was designed for the simulation of homogeneous turbulence (Rogallo, 1981). Periodic boundary conditions are applied
in all three directions; this implies that there is actually a periodic array of
grids but this causes no problem so long as the distance between neighboring grids is sufficiently greater than the distance required for the turbulence
to decay. The code uses the Fourier spectral method with periodic boundary conditions in all three spatial directions and a third-order Runge-Kutta
method in time.
These results illustrate some important features of DNS. The method
allows one to compute statistical quantities that can be compared with experimental data t o validate the results. It also allows computation of quantities that are difficult t o measure in the laboratory and that are useful in
assessing models. At the same time, the method yields visualizations of the
flow that can provide insight into the physics of the turbulence. It is rarely
possible to obtain both statistical data and visualizations of the same flow
in a laboratory. As the example above shows, the combination can be very
valuable.
In direct numerical simulations, one can control the external variables in
a manner that is difficult or impossible to implement in the laboratory. There
have been several cases in which the results produced by DNS disagreed with
those of experiments and the former turned out to be more nearly correct.
One example is the distribution of turbulent statistics near a wall in a channel flow; the results of Kim et al. (1987) proved to be more accurate than
the experiments when both were repeated with more care. An earlier example was provided by Bardina et al. (1980) which explained some apparently