

8.4 Diffusion and Mixing in the Ocean
a
top
layer
bottom
layer
b
density profile
(temperature)
,
,
o
density profile
(salinity)
+ -----net density
profile
,
,
-------i.~ increasing density
o
o
8 0
o
o o
285
8
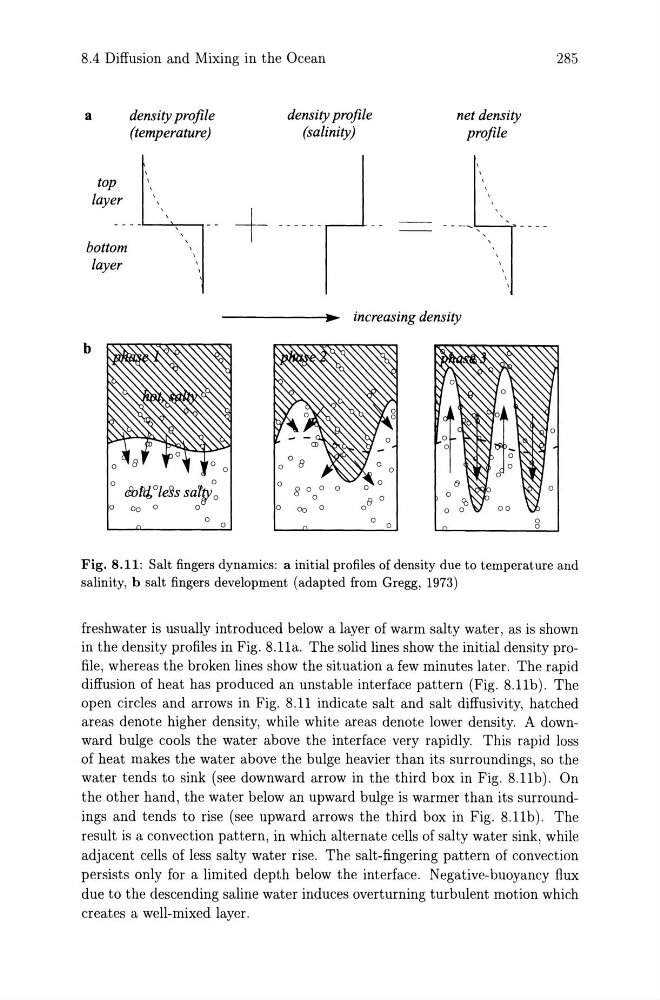
Fig. 8.11: Salt fingers dynamics: a initial profiles of density due to temperature and
salinity, b salt fingers development (adapted from Gregg, 1973)
freshwater is usually introduced below a layer of warm salty water, as is shown
in the density profiles in Fig. 8.11a. The solid lines show the initial density profile, whereas the broken lines show the situation a few minutes later. The rapid
diffusion of heat has produced an unstable interface pattern (Fig. 8.11 b). The
open circles and arrows in Fig. 8.11 indicate salt and salt diffusivity, hatched
areas denote higher density, while white areas denote lower density. A downward bulge cools the water above the interface very rapidly. This rapid loss
of heat makes the water above the bulge heavier than its surroundings, so the
water tends to sink (see downward arrow in the third box in Fig. 8.11b). On
the other hand, the water below an upward bulge is warmer than its surroundings and tends to rise (see upward arrows the third box in Fig. 8.11b). The
result is a convection pattern, in which alternate cells of salty water sink, while
adjacent cells of less salty water rise. The salt-fingering pattern of convection
persists only for a limited depth below the interface. Negative-buoyancy flux
due to the descending saline water induces overturning turbulent motion which
creates a well-mixed layer.
a
top
layer
bottom
layer
b
density profile
(temperature)
,
,
o
density profile
(salinity)
+ -----net density
profile
,
,
-------i.~ increasing density
o
o
8 0
o
o o
285
8
Fig. 8.11: Salt fingers dynamics: a initial profiles of density due to temperature and
salinity, b salt fingers development (adapted from Gregg, 1973)
freshwater is usually introduced below a layer of warm salty water, as is shown
in the density profiles in Fig. 8.11a. The solid lines show the initial density profile, whereas the broken lines show the situation a few minutes later. The rapid
diffusion of heat has produced an unstable interface pattern (Fig. 8.11 b). The
open circles and arrows in Fig. 8.11 indicate salt and salt diffusivity, hatched
areas denote higher density, while white areas denote lower density. A downward bulge cools the water above the interface very rapidly. This rapid loss
of heat makes the water above the bulge heavier than its surroundings, so the
water tends to sink (see downward arrow in the third box in Fig. 8.11b). On
the other hand, the water below an upward bulge is warmer than its surroundings and tends to rise (see upward arrows the third box in Fig. 8.11b). The
result is a convection pattern, in which alternate cells of salty water sink, while
adjacent cells of less salty water rise. The salt-fingering pattern of convection
persists only for a limited depth below the interface. Negative-buoyancy flux
due to the descending saline water induces overturning turbulent motion which
creates a well-mixed layer.