

7.6 EI Nino and Southern Oscillation
227
a ~ 0r------~~--------------lr----~~~~~
.g
2 warm water
~
coldwater
160 0 E
180°
160 0 W 1400W 1200W 1000W
b
warm water
coldwater
160 0 E
180°
160 0 W 1400W 1200W 1000W
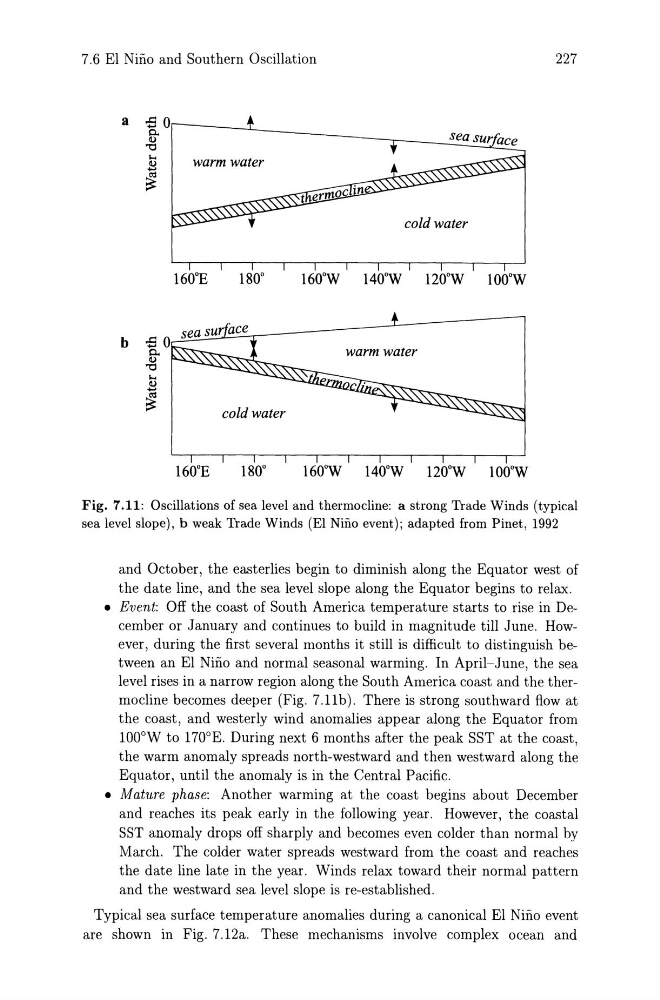
Fig. 7.11: Oscillations of sea level and thermocline: a strong Trade Winds (typical
sea level slope), b weak Trade Winds (El Nino event); adapted from Pinet, 1992
and October, the easterlies begin to diminish along the Equator west of
the date line, and the sea level slope along the Equator begins to relax.
• Event: Off the coast of South America temperature starts to rise in December or January and continues to build in magnitude till June. However, during the first several months it still is difficult to distinguish between an EI Nino and normal seasonal warming. In April-June, the sea
level rises in a narrow region along the South America coast and the thermocline becomes deeper (Fig. 7.11 b). There is strong southward flow at
the coast, and westerly wind anomalies appear along the Equator from
lOOoW to 170°E. During next 6 months after the peak SST at the coast,
the warm anomaly spreads north-westward and then westward along the
Equator, until the anomaly is in the Central Pacific.
• M atuTe phase: Another warming at the coast begins about December
and reaches its peak early in the following year. However, the coastal
SST anomaly drops off sharply and becomes even colder than normal by
March. The colder water spreads westward from the coast and reaches
the date line late in the year. Winds relax toward their normal pattern
and the westward sea level slope is re-established.
Typical sea surface temperature anomalies during a canonical EI Nino event
are shown in Fig. 7.12a. These mechanisms involve complex ocean and
227
a ~ 0r------~~--------------lr----~~~~~
.g
2 warm water
~
coldwater
160 0 E
180°
160 0 W 1400W 1200W 1000W
b
warm water
coldwater
160 0 E
180°
160 0 W 1400W 1200W 1000W
Fig. 7.11: Oscillations of sea level and thermocline: a strong Trade Winds (typical
sea level slope), b weak Trade Winds (El Nino event); adapted from Pinet, 1992
and October, the easterlies begin to diminish along the Equator west of
the date line, and the sea level slope along the Equator begins to relax.
• Event: Off the coast of South America temperature starts to rise in December or January and continues to build in magnitude till June. However, during the first several months it still is difficult to distinguish between an EI Nino and normal seasonal warming. In April-June, the sea
level rises in a narrow region along the South America coast and the thermocline becomes deeper (Fig. 7.11 b). There is strong southward flow at
the coast, and westerly wind anomalies appear along the Equator from
lOOoW to 170°E. During next 6 months after the peak SST at the coast,
the warm anomaly spreads north-westward and then westward along the
Equator, until the anomaly is in the Central Pacific.
• M atuTe phase: Another warming at the coast begins about December
and reaches its peak early in the following year. However, the coastal
SST anomaly drops off sharply and becomes even colder than normal by
March. The colder water spreads westward from the coast and reaches
the date line late in the year. Winds relax toward their normal pattern
and the westward sea level slope is re-established.
Typical sea surface temperature anomalies during a canonical EI Nino event
are shown in Fig. 7.12a. These mechanisms involve complex ocean and