

7.6 El Nino and Southern Oscillation
' """"
......
S5 30 ~
'-'
~
] 20
......
:::
o
......
~
·0
CI)
o
e -10
I<)
~ o -20
r.fl
-30
o
225
La Nina events
o
-40L-L-~~J-~~-L-L~~~~~~~~~L-L-~-,
1970 1972 1974 1976 1978 1980 1982 1984 1986 1988 1990
Time (years)
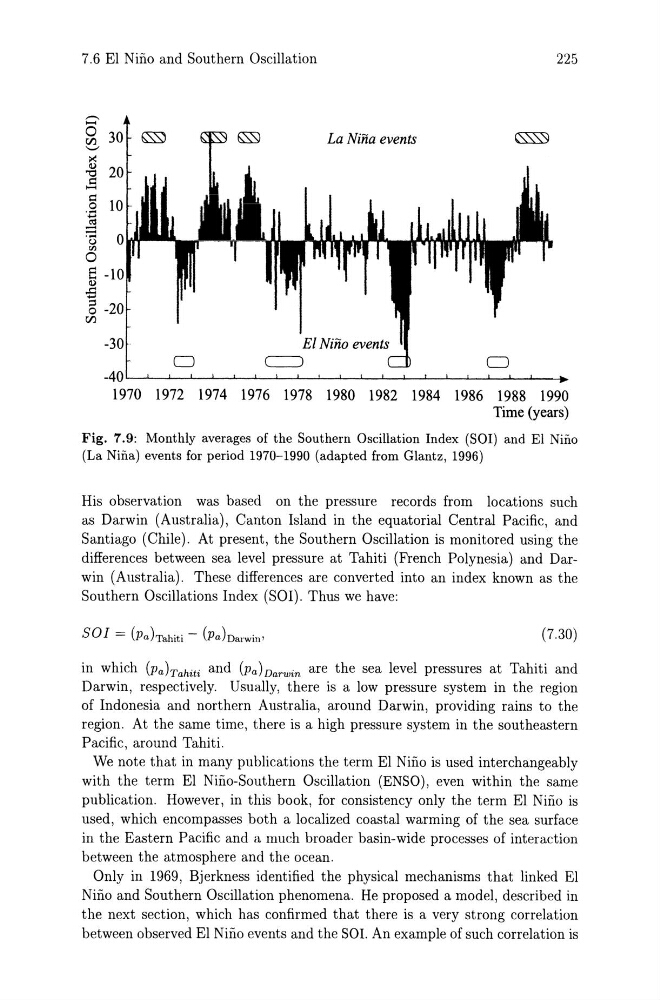
Fig. 7.9: Monthly averages of the Southern Oscillation Index (SOl) and El Nino
(La Nina) events for period 1970-1990 (adapted from Glantz, 1996)
His observation was based on the pressure records from locations such
as Darwin (Australia), Canton Island in the equatorial Central Pacific, and
Santiago (Chile). At present, the Southern Oscillation is monitored using the
differences between sea level pressure at Tahiti (French Polynesia) and Darwin (Australia). These differences are converted into an index known as the
Southern Oscillations Index (SOl). Thus we have:
(7.30)
in which (Pahahiti and (Pa) Darwin are the sea level pressures at Tahiti and
Darwin, respectively. Usually, there is a low pressure system in the region
of Indonesia and northern Australia, around Darwin, providing rains to the
region. At the same time, there is a high pressure system in the southeastern
Pacific, around Tahiti.
We note that in many publications the term El Nino is used interchangeably
with the term El Nino-Southern Oscillation (ENSO), even within the same
publication. However, in this book, for consistency only the term El Nino is
used, which encompasses both a localized coastal warming of the sea surface
in the Eastern Pacific and a much broader basin-wide processes of interaction
between the atmosphere and the ocean.
Only in 1969, Bjerkness identified the physical mechanisms that linked El
Nino and Southern Oscillation phenomena. He proposed a model, described in
the next section, which has confirmed that there is a very strong correlation
between observed El Nino events and the SOL An example of such correlation is
' """"
......
S5 30 ~
'-'
~
] 20
......
:::
o
......
~
·0
CI)
o
e -10
I<)
~ o -20
r.fl
-30
o
225
La Nina events
o
-40L-L-~~J-~~-L-L~~~~~~~~~L-L-~-,
1970 1972 1974 1976 1978 1980 1982 1984 1986 1988 1990
Time (years)
Fig. 7.9: Monthly averages of the Southern Oscillation Index (SOl) and El Nino
(La Nina) events for period 1970-1990 (adapted from Glantz, 1996)
His observation was based on the pressure records from locations such
as Darwin (Australia), Canton Island in the equatorial Central Pacific, and
Santiago (Chile). At present, the Southern Oscillation is monitored using the
differences between sea level pressure at Tahiti (French Polynesia) and Darwin (Australia). These differences are converted into an index known as the
Southern Oscillations Index (SOl). Thus we have:
(7.30)
in which (Pahahiti and (Pa) Darwin are the sea level pressures at Tahiti and
Darwin, respectively. Usually, there is a low pressure system in the region
of Indonesia and northern Australia, around Darwin, providing rains to the
region. At the same time, there is a high pressure system in the southeastern
Pacific, around Tahiti.
We note that in many publications the term El Nino is used interchangeably
with the term El Nino-Southern Oscillation (ENSO), even within the same
publication. However, in this book, for consistency only the term El Nino is
used, which encompasses both a localized coastal warming of the sea surface
in the Eastern Pacific and a much broader basin-wide processes of interaction
between the atmosphere and the ocean.
Only in 1969, Bjerkness identified the physical mechanisms that linked El
Nino and Southern Oscillation phenomena. He proposed a model, described in
the next section, which has confirmed that there is a very strong correlation
between observed El Nino events and the SOL An example of such correlation is