

96
3 An Introduction to Surface Waves
v = 20m/s
w
v = 15 m/s
w
3
0.2
0.4
0.6
0.8
1.0
1.2
1.4
1.6
1.8
2.0
2.2
Frequency (radls)
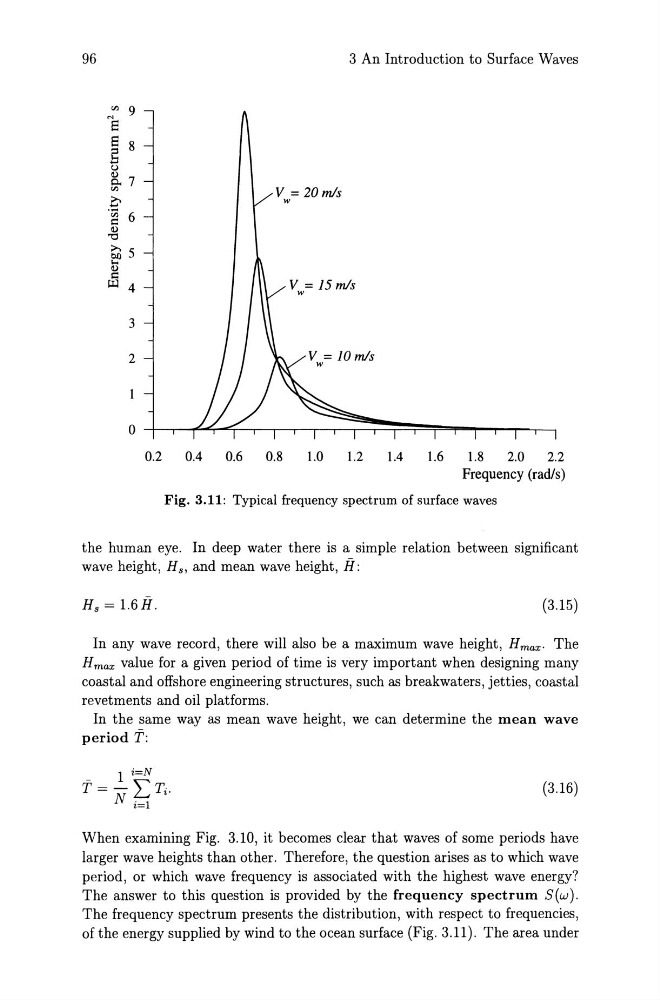
Fig. 3.11: Typical frequency spectrum of surface waves
the human eye. In deep water there is a simple relation between significant
wave height, H., and mean wave height, H:
Hs=1.6H.
(3.15)
In any wave record, there will also be a maximum wave height, Hmax. The
H max value for a given period of time is very important when designing many
coastal and offshore engineering structures, such as breakwaters, jetties, coastal
revetments and oil platforms.
In the same way as mean wave height, we can determine the mean wave
period T:
_
1 i=N
T = - LTi .
N i=l
(3.16)
When examining Fig. 3.10, it becomes clear that waves of some periods have
larger wave heights than other. Therefore, the question arises as to which wave
period, or which wave frequency is associated with the highest wave energy?
The answer to this question is provided by the frequency spectrum S(w).
The frequency spectrum presents the distribution, with respect to frequencies,
of the energy supplied by wind to the ocean surface (Fig. 3.11). The area under
3 An Introduction to Surface Waves
v = 20m/s
w
v = 15 m/s
w
3
0.2
0.4
0.6
0.8
1.0
1.2
1.4
1.6
1.8
2.0
2.2
Frequency (radls)
Fig. 3.11: Typical frequency spectrum of surface waves
the human eye. In deep water there is a simple relation between significant
wave height, H., and mean wave height, H:
Hs=1.6H.
(3.15)
In any wave record, there will also be a maximum wave height, Hmax. The
H max value for a given period of time is very important when designing many
coastal and offshore engineering structures, such as breakwaters, jetties, coastal
revetments and oil platforms.
In the same way as mean wave height, we can determine the mean wave
period T:
_
1 i=N
T = - LTi .
N i=l
(3.16)
When examining Fig. 3.10, it becomes clear that waves of some periods have
larger wave heights than other. Therefore, the question arises as to which wave
period, or which wave frequency is associated with the highest wave energy?
The answer to this question is provided by the frequency spectrum S(w).
The frequency spectrum presents the distribution, with respect to frequencies,
of the energy supplied by wind to the ocean surface (Fig. 3.11). The area under