

90
resonance
model
3 An Introduction to Surface Waves
saturation
Time
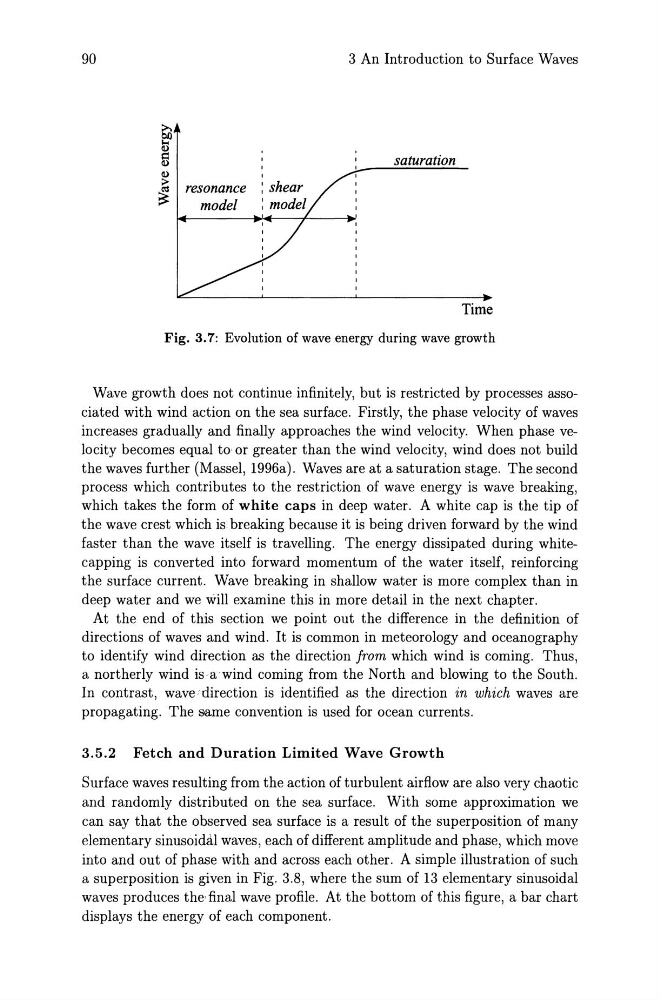
Fig. 3.7: Evolution of wave energy during wave growth
Wave growth does not continue infinitely, but is restricted by processes associated with wind action on the sea surface. Firstly, the phase velocity of waves
increases gradually and finally approaches the wind velocity. When phase velocity becomes equal to or greater than the wind velocity, wind does not build
the waves further (Massel, 1996a). Waves are at a saturation stage. The second
process which contributes to the restriction of wave energy is wave breaking,
which takes the form of white caps in deep water. A white cap is the tip of
the wave crest which is breaking because it is being driven forward by the wind
faster than the wave itself is travelling. The energy dissipated during whitecapping is converted into forward momentum of the water itself, reinforcing
the surface current. Wave breaking in shallow water is more complex than in
deep water and we will examine this in more detail in the next chapter.
At the end of this section we point out the difference in the definition of
directions of waves and wind. It is common in meteorology and oceanography
to identify wind direction as the direction from which wind is coming. Thus,
a northerly wind is a wind coming from the North and blowing to the South.
In contrast, wave direction is identified as the direction in which waves are
propagating. The same convention is used for ocean currents.
3.5.2 Fetch and Duration Limited Wave Growth
Surface waves resulting from the action of turbulent airflow are also very chaotic
and randomly distributed on the sea surface. With some approximation we
can say that the observed sea surface is a result of the superposition of many
elementary sinusoidal waves, each of different amplitude and phase, which move
into and out of phase with and across each other. A simple illustration of such
a superposition is given in Fig. 3.8, where the sum of 13 elementary sinusoidal
waves produces the' final wave profile. At the bottom of this figure, a bar chart
displays the energy of each component.
resonance
model
3 An Introduction to Surface Waves
saturation
Time
Fig. 3.7: Evolution of wave energy during wave growth
Wave growth does not continue infinitely, but is restricted by processes associated with wind action on the sea surface. Firstly, the phase velocity of waves
increases gradually and finally approaches the wind velocity. When phase velocity becomes equal to or greater than the wind velocity, wind does not build
the waves further (Massel, 1996a). Waves are at a saturation stage. The second
process which contributes to the restriction of wave energy is wave breaking,
which takes the form of white caps in deep water. A white cap is the tip of
the wave crest which is breaking because it is being driven forward by the wind
faster than the wave itself is travelling. The energy dissipated during whitecapping is converted into forward momentum of the water itself, reinforcing
the surface current. Wave breaking in shallow water is more complex than in
deep water and we will examine this in more detail in the next chapter.
At the end of this section we point out the difference in the definition of
directions of waves and wind. It is common in meteorology and oceanography
to identify wind direction as the direction from which wind is coming. Thus,
a northerly wind is a wind coming from the North and blowing to the South.
In contrast, wave direction is identified as the direction in which waves are
propagating. The same convention is used for ocean currents.
3.5.2 Fetch and Duration Limited Wave Growth
Surface waves resulting from the action of turbulent airflow are also very chaotic
and randomly distributed on the sea surface. With some approximation we
can say that the observed sea surface is a result of the superposition of many
elementary sinusoidal waves, each of different amplitude and phase, which move
into and out of phase with and across each other. A simple illustration of such
a superposition is given in Fig. 3.8, where the sum of 13 elementary sinusoidal
waves produces the' final wave profile. At the bottom of this figure, a bar chart
displays the energy of each component.