

274
Marine Mammal Physiology: Requisites for Ocean Living
(a)
(b)
F requency (Hz)
0
400
800
Velocity (µm/s)
1200
1600
2000
10
20
30
40
50
80
100
(c)
246 mm
1
Flow speed (mm/s)
3
4
2
60
0
Time (s)
(d)
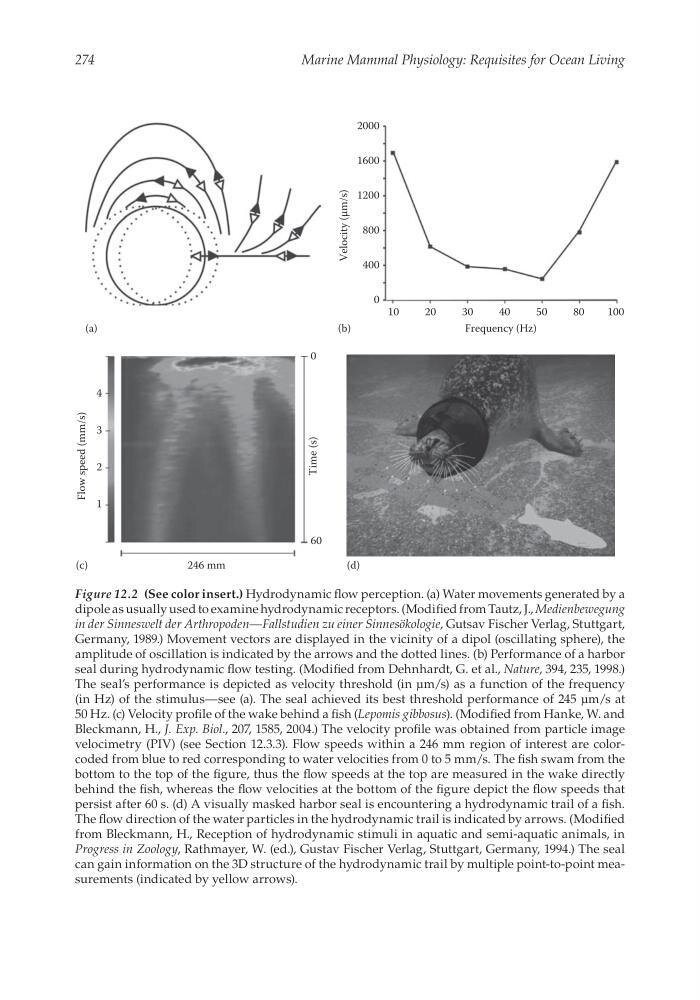
Figure 12.2 (See color insert.) Hydrodynamic flow perception. (a) Water movements generated by a
dipole as usually used to examine hydrodynamic receptors. (Modified from Tautz, J., Medienbewegung
in der Sinneswelt der Arthropoden—Fallstudien zu einer Sinnesökologie, Gutsav Fischer Verlag, Stuttgart,
Germany, 1989.) Movement vectors are displayed in the vicinity of a dipol (os cillating sphere), the
amplitude of oscillation is indicated by the arrows and the dotted lines. (b) Performance of a harbor
seal during hydrodynamic flow testing. (Modified from Dehnhardt, G. et al., Nature, 394, 235, 1998.)
The seal’s performance is depicted as velocity threshold (in µm/s) as a function of the frequency
(in Hz) of the stimulus—see (a). The seal achieved its best threshold performance of 245 µm/s at
50 Hz. (c) Velocity profile of the wake behind a fish (Lepomis gibbosus). (Modified from Hanke, W. and
Bleckmann, H., J. Exp. Biol., 207, 1585, 2004.) The velocity profile was obtained from particle image
velocimetry (PIV) (see Section 12.3.3). Flow speeds within a 246 mm region of interest are colorcoded from blue to red corresponding to water velocities from 0 to 5 mm/s. The fish swam from the
bottom to the top of the figure, thus the flow speeds at the top are measured in the wake directly
behind the fish, whereas the flow velocities at the bottom of the figure depict the flow speeds that
persist after 60 s. (d) A visually masked harbor seal is encountering a hydrodynamic trail of a fish.
The flow direction of the water particles in the hydrodynamic trail is indicated by arrows. (Modified
from Bleckmann, H., Reception of hydrodynamic stimuli in aquatic and semi-aquatic animals, in
Progress in Zoology, Rathmayer, W. (ed.), Gustav Fischer Verlag, Stuttgart, Germany, 1994.) The seal
can gain information on the 3D structure of the hydrodynamic trail by multiple point-to-point measurements (indicated by yellow arrows).
Marine Mammal Physiology: Requisites for Ocean Living
(a)
(b)
F requency (Hz)
0
400
800
Velocity (µm/s)
1200
1600
2000
10
20
30
40
50
80
100
(c)
246 mm
1
Flow speed (mm/s)
3
4
2
60
0
Time (s)
(d)
Figure 12.2 (See color insert.) Hydrodynamic flow perception. (a) Water movements generated by a
dipole as usually used to examine hydrodynamic receptors. (Modified from Tautz, J., Medienbewegung
in der Sinneswelt der Arthropoden—Fallstudien zu einer Sinnesökologie, Gutsav Fischer Verlag, Stuttgart,
Germany, 1989.) Movement vectors are displayed in the vicinity of a dipol (os cillating sphere), the
amplitude of oscillation is indicated by the arrows and the dotted lines. (b) Performance of a harbor
seal during hydrodynamic flow testing. (Modified from Dehnhardt, G. et al., Nature, 394, 235, 1998.)
The seal’s performance is depicted as velocity threshold (in µm/s) as a function of the frequency
(in Hz) of the stimulus—see (a). The seal achieved its best threshold performance of 245 µm/s at
50 Hz. (c) Velocity profile of the wake behind a fish (Lepomis gibbosus). (Modified from Hanke, W. and
Bleckmann, H., J. Exp. Biol., 207, 1585, 2004.) The velocity profile was obtained from particle image
velocimetry (PIV) (see Section 12.3.3). Flow speeds within a 246 mm region of interest are colorcoded from blue to red corresponding to water velocities from 0 to 5 mm/s. The fish swam from the
bottom to the top of the figure, thus the flow speeds at the top are measured in the wake directly
behind the fish, whereas the flow velocities at the bottom of the figure depict the flow speeds that
persist after 60 s. (d) A visually masked harbor seal is encountering a hydrodynamic trail of a fish.
The flow direction of the water particles in the hydrodynamic trail is indicated by arrows. (Modified
from Bleckmann, H., Reception of hydrodynamic stimuli in aquatic and semi-aquatic animals, in
Progress in Zoology, Rathmayer, W. (ed.), Gustav Fischer Verlag, Stuttgart, Germany, 1994.) The seal
can gain information on the 3D structure of the hydrodynamic trail by multiple point-to-point measurements (indicated by yellow arrows).