

296
The Biology of Sea Turtles, Vol. II
Carolina, South Carolina, Georgia, and northern Florida (the northern nesting population) have failed to increase despite 15 years of TEDs in shrimp trawls. Model
analyses predicted that if large juvenile, subadult, and adult turtles experienced
higher survival rates because of TEDs, the population should show signs of recovery.
Assuming that our assumptions about loggerhead life history are generally correct
(i.e., the general model structure is correct), there are at least three reasons why
loggerhead nesting populations are not increasing:
1. TEDs do not reduce mortality enough or do not benefit all loggerheads.
2. The time lag to maturity is preventing us from observing population
response on the nesting beach.
3. Other mortality sources are reducing the realized benefits of TEDs.
None of these are mutually exclusive; in fact, all three could be operating
simultaneously. Unfortunately, nesting beach counts alone cannot distinguish among
these hypotheses. A mark–recapture study to estimate survival rates is needed to
compare current survival rate estimates with those of Frazer (1987), which were
calculated prior to TED implementation. A preliminary analysis using catch-curve
estimation of stranded turtles suggested an increase in annual survival rates pre- and
post-TED (NMFS, 2001). Population and size distribution estimates of juveniles
could be used to determine whether this segment of the population is increasing and
whether factors such as pelagic longlines could be affecting recruitment to the
benthic feeding stage. Finally, an analysis of size distributions and locations of
strandings could reveal whether TEDs are selectively excluding certain size classes
of turtles, as postulated by Epperly and Teas (1999).
Few studies are long enough or over a broad enough spatial scale to estimate
abundance or trends for entire populations; we are nearly always forced to extrapolate
well beyond the data we have. Exceptions are the long-term mark–recapture and
survey efforts for greens and loggerheads in Australia (Chaloupka and Limpus, 2001)
and nesting beach data for Kemp’s ridleys, in which the entire species was reduced
to a few hundred females on a single nesting beach (Turtle Expert Working Group,
2000; Heppell et al., 2002a). Long-term studies of multiple life stages are essential
to document population change through time.
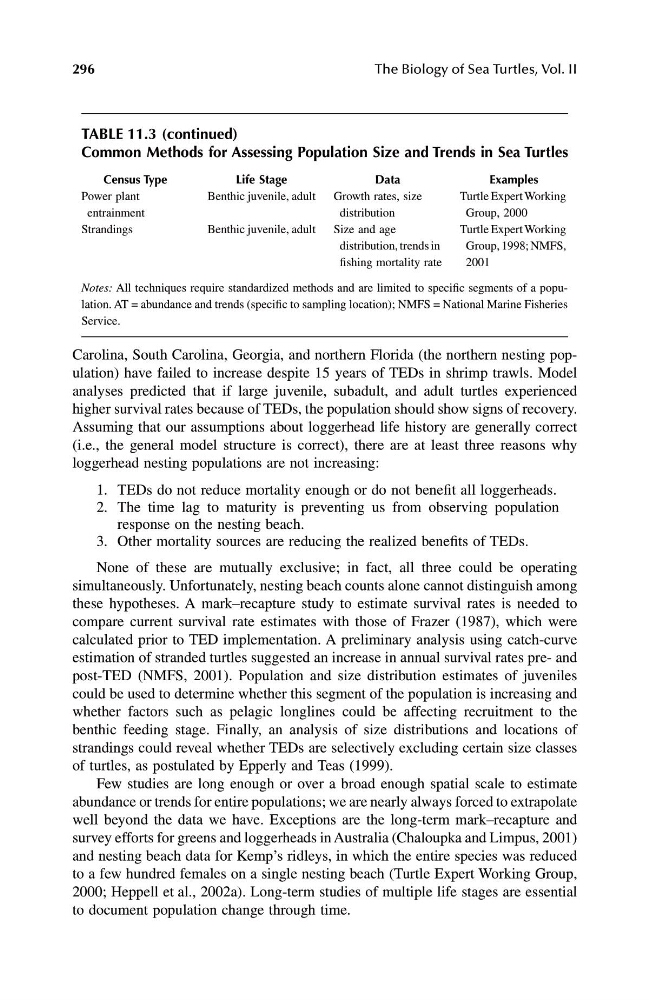
TABLE 11.3 (continued)
Common Methods for Assessing Population Size and Trends in Sea Turtles
Census Type
Life Stage
Data
Examples
Power plant
entrainment
Benthic juvenile, adult Growth rates, size
distribution
Turtle Expert Working
Group, 2000
Strandings
Benthic juvenile, adult Size and age
distribution, trends in
fishing mortality rate
Turtle Expert Working
Group, 1998; NMFS,
2001
Notes: All techniques require standardized methods and are limited to specific segments of a population. AT = abundance and trends (specific to sampling location); NMFS = National Marine Fisheries
Service.
1123 book.book Page 296 Tuesday, November 12, 2002 7:43 AM
The Biology of Sea Turtles, Vol. II
Carolina, South Carolina, Georgia, and northern Florida (the northern nesting population) have failed to increase despite 15 years of TEDs in shrimp trawls. Model
analyses predicted that if large juvenile, subadult, and adult turtles experienced
higher survival rates because of TEDs, the population should show signs of recovery.
Assuming that our assumptions about loggerhead life history are generally correct
(i.e., the general model structure is correct), there are at least three reasons why
loggerhead nesting populations are not increasing:
1. TEDs do not reduce mortality enough or do not benefit all loggerheads.
2. The time lag to maturity is preventing us from observing population
response on the nesting beach.
3. Other mortality sources are reducing the realized benefits of TEDs.
None of these are mutually exclusive; in fact, all three could be operating
simultaneously. Unfortunately, nesting beach counts alone cannot distinguish among
these hypotheses. A mark–recapture study to estimate survival rates is needed to
compare current survival rate estimates with those of Frazer (1987), which were
calculated prior to TED implementation. A preliminary analysis using catch-curve
estimation of stranded turtles suggested an increase in annual survival rates pre- and
post-TED (NMFS, 2001). Population and size distribution estimates of juveniles
could be used to determine whether this segment of the population is increasing and
whether factors such as pelagic longlines could be affecting recruitment to the
benthic feeding stage. Finally, an analysis of size distributions and locations of
strandings could reveal whether TEDs are selectively excluding certain size classes
of turtles, as postulated by Epperly and Teas (1999).
Few studies are long enough or over a broad enough spatial scale to estimate
abundance or trends for entire populations; we are nearly always forced to extrapolate
well beyond the data we have. Exceptions are the long-term mark–recapture and
survey efforts for greens and loggerheads in Australia (Chaloupka and Limpus, 2001)
and nesting beach data for Kemp’s ridleys, in which the entire species was reduced
to a few hundred females on a single nesting beach (Turtle Expert Working Group,
2000; Heppell et al., 2002a). Long-term studies of multiple life stages are essential
to document population change through time.
TABLE 11.3 (continued)
Common Methods for Assessing Population Size and Trends in Sea Turtles
Census Type
Life Stage
Data
Examples
Power plant
entrainment
Benthic juvenile, adult Growth rates, size
distribution
Turtle Expert Working
Group, 2000
Strandings
Benthic juvenile, adult Size and age
distribution, trends in
fishing mortality rate
Turtle Expert Working
Group, 1998; NMFS,
2001
Notes: All techniques require standardized methods and are limited to specific segments of a population. AT = abundance and trends (specific to sampling location); NMFS = National Marine Fisheries
Service.
1123 book.book Page 296 Tuesday, November 12, 2002 7:43 AM