

252
The Biology of Sea Turtles, Vol. II
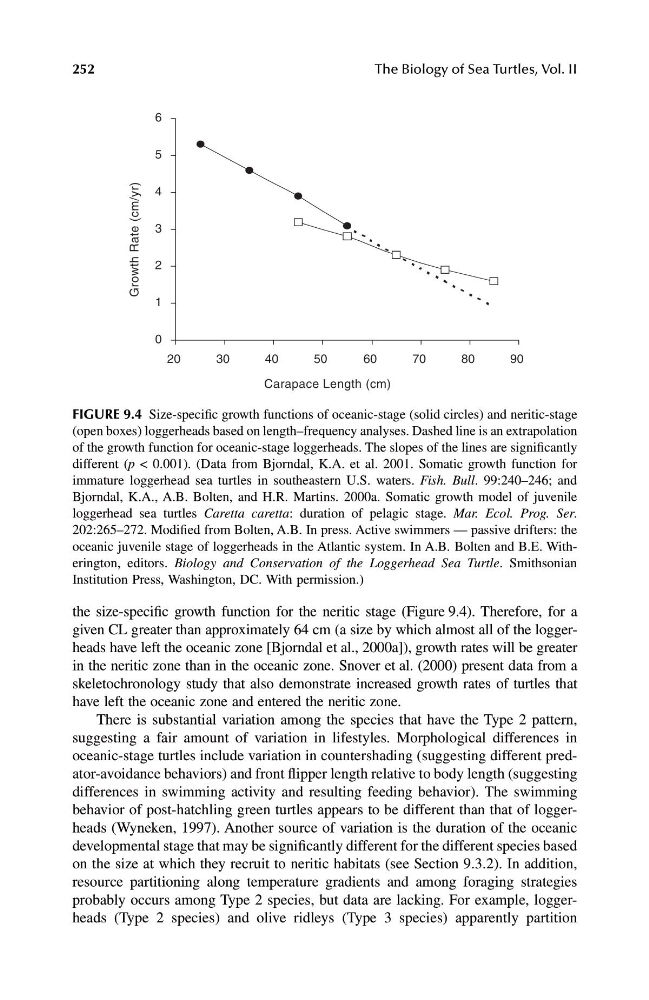
the size-specific growth function for the neritic stage (Figure 9.4). Therefore, for a
given CL greater than approximately 64 cm (a size by which almost all of the loggerheads have left the oceanic zone [Bjorndal et al., 2000a]), growth rates will be greater
in the neritic zone than in the oceanic zone. Snover et al. (2000) present data from a
skeletochronology study that also demonstrate increased growth rates of turtles that
have left the oceanic zone and entered the neritic zone.
There is substantial variation among the species that have the Type 2 pattern,
suggesting a fair amount of variation in lifestyles. Morphological differences in
oceanic-stage turtles include variation in countershading (suggesting different predator-avoidance behaviors) and front flipper length relative to body length (suggesting
differences in swimming activity and resulting feeding behavior). The swimming
behavior of post-hatchling green turtles appears to be different than that of loggerheads (Wyneken, 1997). Another source of variation is the duration of the oceanic
developmental stage that may be significantly different for the different species based
on the size at which they recruit to neritic habitats (see Section 9.3.2). In addition,
resource partitioning along temperature gradients and among foraging strategies
probably occurs among Type 2 species, but data are lacking. For example, loggerheads (Type 2 species) and olive ridleys (Type 3 species) apparently partition
FIGURE 9.4 Size-specific growth functions of oceanic-stage (solid circles) and neritic-stage
(open boxes) loggerheads based on length–frequency analyses. Dashed line is an extrapolation
of the growth function for oceanic-stage loggerheads. The slopes of the lines are significantly
different ( p < 0.001). (Data from Bjorndal, K.A. et al. 2001. Somatic growth function for
immature loggerhead sea turtles in southeastern U.S. waters. Fish. Bull . 99:240–246; and
Bjorndal, K.A., A.B. Bolten, and H.R. Martins. 2000a. Somatic growth model of juvenile
loggerhead sea turtles Caretta caretta : duration of pelagic stage. Mar. Ecol. Prog. Ser .
202:265–272. Modified from Bolten, A.B. In press. Active swimmers — passive drifters: the
oceanic juvenile stage of loggerheads in the Atlantic system. In A.B. Bolten and B.E. Witherington, editors. Biology and Conservation of the Loggerhead Sea Turtle . Smithsonian
Institution Press, Washington, DC. With permission.)
20
30
40
50
60
70
80
90
0
1
2
3
4
5
6
Growth Rate (cm/yr)
Carapace Length (cm)
1123 book.book Page 252 Monday, November 11, 2002 11:11 AM
The Biology of Sea Turtles, Vol. II
the size-specific growth function for the neritic stage (Figure 9.4). Therefore, for a
given CL greater than approximately 64 cm (a size by which almost all of the loggerheads have left the oceanic zone [Bjorndal et al., 2000a]), growth rates will be greater
in the neritic zone than in the oceanic zone. Snover et al. (2000) present data from a
skeletochronology study that also demonstrate increased growth rates of turtles that
have left the oceanic zone and entered the neritic zone.
There is substantial variation among the species that have the Type 2 pattern,
suggesting a fair amount of variation in lifestyles. Morphological differences in
oceanic-stage turtles include variation in countershading (suggesting different predator-avoidance behaviors) and front flipper length relative to body length (suggesting
differences in swimming activity and resulting feeding behavior). The swimming
behavior of post-hatchling green turtles appears to be different than that of loggerheads (Wyneken, 1997). Another source of variation is the duration of the oceanic
developmental stage that may be significantly different for the different species based
on the size at which they recruit to neritic habitats (see Section 9.3.2). In addition,
resource partitioning along temperature gradients and among foraging strategies
probably occurs among Type 2 species, but data are lacking. For example, loggerheads (Type 2 species) and olive ridleys (Type 3 species) apparently partition
FIGURE 9.4 Size-specific growth functions of oceanic-stage (solid circles) and neritic-stage
(open boxes) loggerheads based on length–frequency analyses. Dashed line is an extrapolation
of the growth function for oceanic-stage loggerheads. The slopes of the lines are significantly
different ( p < 0.001). (Data from Bjorndal, K.A. et al. 2001. Somatic growth function for
immature loggerhead sea turtles in southeastern U.S. waters. Fish. Bull . 99:240–246; and
Bjorndal, K.A., A.B. Bolten, and H.R. Martins. 2000a. Somatic growth model of juvenile
loggerhead sea turtles Caretta caretta : duration of pelagic stage. Mar. Ecol. Prog. Ser .
202:265–272. Modified from Bolten, A.B. In press. Active swimmers — passive drifters: the
oceanic juvenile stage of loggerheads in the Atlantic system. In A.B. Bolten and B.E. Witherington, editors. Biology and Conservation of the Loggerhead Sea Turtle . Smithsonian
Institution Press, Washington, DC. With permission.)
20
30
40
50
60
70
80
90
0
1
2
3
4
5
6
Growth Rate (cm/yr)
Carapace Length (cm)
1123 book.book Page 252 Monday, November 11, 2002 11:11 AM