

Monitoring Coastal Morphological Changes
519
1979 - 89
1989 - 94
1994 - 96
West
Centre
East
15.0m(1.5m/yr. )
20.5m (4.5m/yr.)
10.0m(1.0m/yr. )
7.5m(1.6m/yr. )
12.0m(6.0m/yr. )
6.0m(0.6m/yr. )
3.5m(0.7m/yr. )
12.0m(6.0m/yr. )
Interpretation
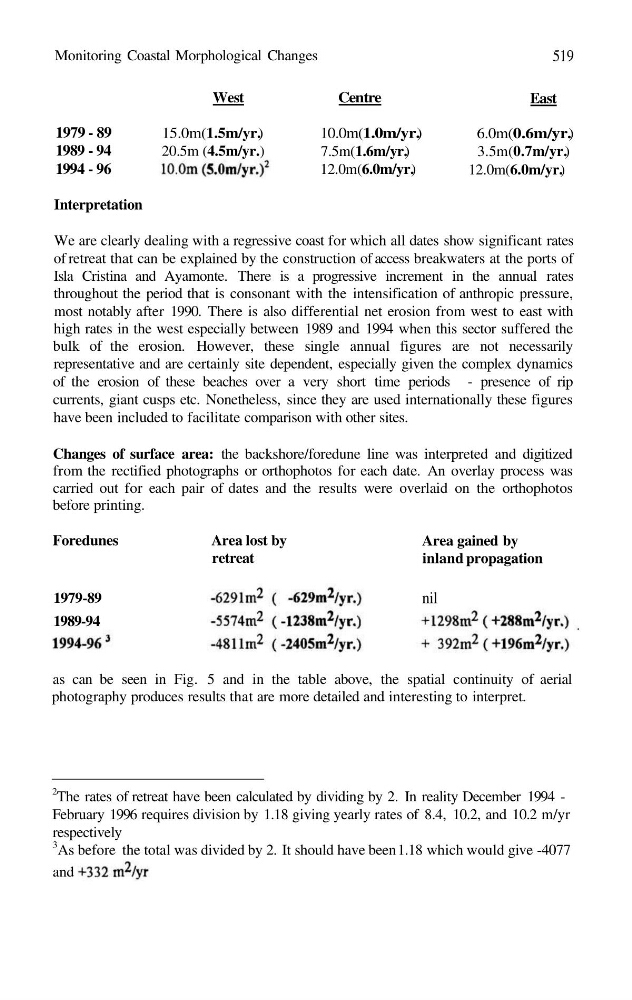
We are clearly dealing with a regressive coast for which all dates show significant rates
of retreat that can be explained by the construction of access breakwaters at the ports of
Isla Cristina and Ayamonte. There is a progressive increment in the annual rates
throughout the period that is consonant with the intensification of anthropic pressure,
most notably after 1990. There is also differential net erosion from west to east with
high rates in the west especially between 1989 and 1994 when this sector suffered the
bulk of the erosion. However, these single annual figures are not necessarily
representative and are certainly site dependent, especially given the complex dynamics
of the erosion of these beaches over a very short time periods - presence of rip
currents, giant cusps etc. Nonetheless, since they are used internationally these figures
have been included to facilitate comparison with other sites.
Changes of surface area: the backshore/foredune line was interpreted and digitized
from the rectified photographs or orthophotos for each date. An overlay process was
carried out for each pair of dates and the results were overlaid on the orthophotos
before printing.
Foredunes
1979-89
1989-94
Area lost by
retreat
Area gained by
inland propagation
nil
as can be seen in Fig. 5 and in the table above, the spatial continuity of aerial
photography produces results that are more detailed and interesting to interpret.
2
The rates of retreat have been calculated by dividing by 2. In reality December 1994 -
February 1996 requires division by 1.18 giving yearly rates of 8.4, 10.2, and 10.2 m/yr
respectively
3
As before the total was divided by 2. It should have been 1.18 which would give -4077
and
519
1979 - 89
1989 - 94
1994 - 96
West
Centre
East
15.0m(1.5m/yr. )
20.5m (4.5m/yr.)
10.0m(1.0m/yr. )
7.5m(1.6m/yr. )
12.0m(6.0m/yr. )
6.0m(0.6m/yr. )
3.5m(0.7m/yr. )
12.0m(6.0m/yr. )
Interpretation
We are clearly dealing with a regressive coast for which all dates show significant rates
of retreat that can be explained by the construction of access breakwaters at the ports of
Isla Cristina and Ayamonte. There is a progressive increment in the annual rates
throughout the period that is consonant with the intensification of anthropic pressure,
most notably after 1990. There is also differential net erosion from west to east with
high rates in the west especially between 1989 and 1994 when this sector suffered the
bulk of the erosion. However, these single annual figures are not necessarily
representative and are certainly site dependent, especially given the complex dynamics
of the erosion of these beaches over a very short time periods - presence of rip
currents, giant cusps etc. Nonetheless, since they are used internationally these figures
have been included to facilitate comparison with other sites.
Changes of surface area: the backshore/foredune line was interpreted and digitized
from the rectified photographs or orthophotos for each date. An overlay process was
carried out for each pair of dates and the results were overlaid on the orthophotos
before printing.
Foredunes
1979-89
1989-94
Area lost by
retreat
Area gained by
inland propagation
nil
as can be seen in Fig. 5 and in the table above, the spatial continuity of aerial
photography produces results that are more detailed and interesting to interpret.
2
The rates of retreat have been calculated by dividing by 2. In reality December 1994 -
February 1996 requires division by 1.18 giving yearly rates of 8.4, 10.2, and 10.2 m/yr
respectively
3
As before the total was divided by 2. It should have been 1.18 which would give -4077
and