

507
Kelp Biomass Assessment Using Remote Sensing
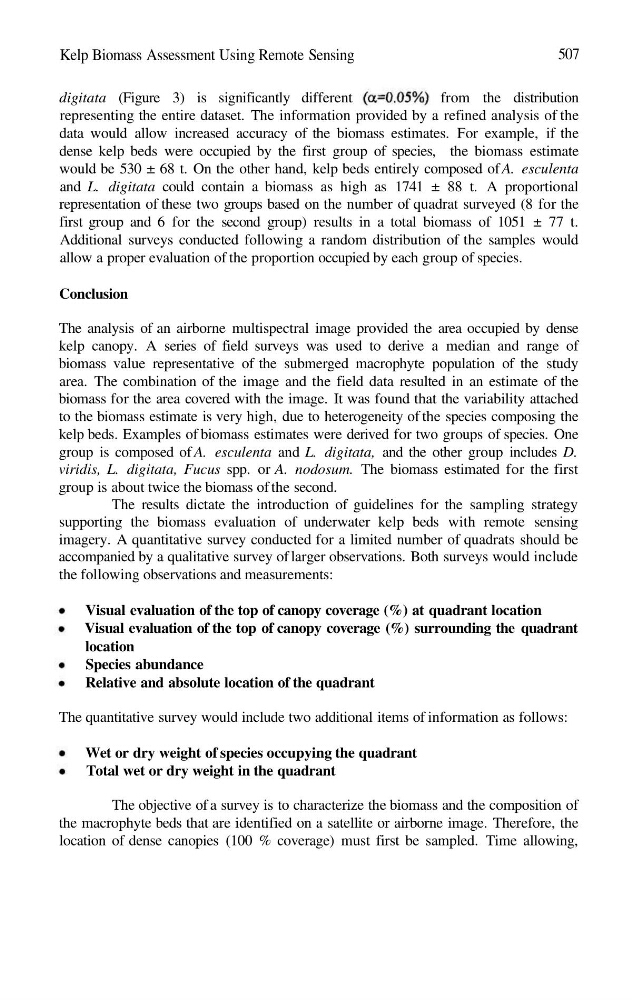
digitata (Figure 3) is significantly different
from the distribution
representing the entire dataset. The information provided by a refined analysis of the
data would allow increased accuracy of the biomass estimates. For example, if the
dense kelp beds were occupied by the first group of species, the biomass estimate
would be 530 ± 68 t. On the other hand, kelp beds entirely composed of A. esculenta
and L. digitata could contain a biomass as high as 1741 ± 88 t. A proportional
representation of these two groups based on the number of quadrat surveyed (8 for the
first group and 6 for the second group) results in a total biomass of 1051 ± 77 t.
Additional surveys conducted following a random distribution of the samples would
allow a proper evaluation of the proportion occupied by each group of species.
Conclusion
The analysis of an airborne multispectral image provided the area occupied by dense
kelp canopy. A series of field surveys was used to derive a median and range of
biomass value representative of the submerged macrophyte population of the study
area. The combination of the image and the field data resulted in an estimate of the
biomass for the area covered with the image. It was found that the variability attached
to the biomass estimate is very high, due to heterogeneity of the species composing the
kelp beds. Examples of biomass estimates were derived for two groups of species. One
group is composed of A. esculenta and L. digitata, and the other group includes D.
viridis, L. digitata, Fucus spp. or A. nodosum. The biomass estimated for the first
group is about twice the biomass of the second.
The results dictate the introduction of guidelines for the sampling strategy
supporting the biomass evaluation of underwater kelp beds with remote sensing
imagery. A quantitative survey conducted for a limited number of quadrats should be
accompanied by a qualitative survey of larger observations. Both surveys would include
the following observations and measurements:
Visual evaluation of the top of canopy coverage (%) at quadrant location
Visual evaluation of the top of canopy coverage (%) surrounding the quadrant
location
Species abundance
Relative and absolute location of the quadrant
The quantitative survey would include two additional items of information as follows:
Wet or dry weight of species occupying the quadrant
Total wet or dry weight in the quadrant
The objective of a survey is to characterize the biomass and the composition of
the macrophyte beds that are identified on a satellite or airborne image. Therefore, the
location of dense canopies (100 % coverage) must first be sampled. Time allowing,
Kelp Biomass Assessment Using Remote Sensing
digitata (Figure 3) is significantly different
from the distribution
representing the entire dataset. The information provided by a refined analysis of the
data would allow increased accuracy of the biomass estimates. For example, if the
dense kelp beds were occupied by the first group of species, the biomass estimate
would be 530 ± 68 t. On the other hand, kelp beds entirely composed of A. esculenta
and L. digitata could contain a biomass as high as 1741 ± 88 t. A proportional
representation of these two groups based on the number of quadrat surveyed (8 for the
first group and 6 for the second group) results in a total biomass of 1051 ± 77 t.
Additional surveys conducted following a random distribution of the samples would
allow a proper evaluation of the proportion occupied by each group of species.
Conclusion
The analysis of an airborne multispectral image provided the area occupied by dense
kelp canopy. A series of field surveys was used to derive a median and range of
biomass value representative of the submerged macrophyte population of the study
area. The combination of the image and the field data resulted in an estimate of the
biomass for the area covered with the image. It was found that the variability attached
to the biomass estimate is very high, due to heterogeneity of the species composing the
kelp beds. Examples of biomass estimates were derived for two groups of species. One
group is composed of A. esculenta and L. digitata, and the other group includes D.
viridis, L. digitata, Fucus spp. or A. nodosum. The biomass estimated for the first
group is about twice the biomass of the second.
The results dictate the introduction of guidelines for the sampling strategy
supporting the biomass evaluation of underwater kelp beds with remote sensing
imagery. A quantitative survey conducted for a limited number of quadrats should be
accompanied by a qualitative survey of larger observations. Both surveys would include
the following observations and measurements:
Visual evaluation of the top of canopy coverage (%) at quadrant location
Visual evaluation of the top of canopy coverage (%) surrounding the quadrant
location
Species abundance
Relative and absolute location of the quadrant
The quantitative survey would include two additional items of information as follows:
Wet or dry weight of species occupying the quadrant
Total wet or dry weight in the quadrant
The objective of a survey is to characterize the biomass and the composition of
the macrophyte beds that are identified on a satellite or airborne image. Therefore, the
location of dense canopies (100 % coverage) must first be sampled. Time allowing,