

503
Kelp Biomass Assessment Using Remote Sensing
The surveys included the proportion of the bottom occupied by stipes and
short plants in
quadrants. The wet weight biomass in
was reported for each
species occupying more than 5 % of the surveyed quadrants.
Methods
A natural logarithm transformation applied to all spectral bands produced a set of
depth dependent variables. A discriminant analysis based on pixels representing kelp
free substrate at various depths resulted with a water depth image (first discriminant
function) and a bottom type image (second discriminant function (Lyzenga, 1978;
Lambert, 1992). The analysis applied to a sub image defined the first discriminant
function coefficients representing water depth variation of 0 to 11 m depth (6 fathoms).
The transformed images which values were strongly correlated with the water depth
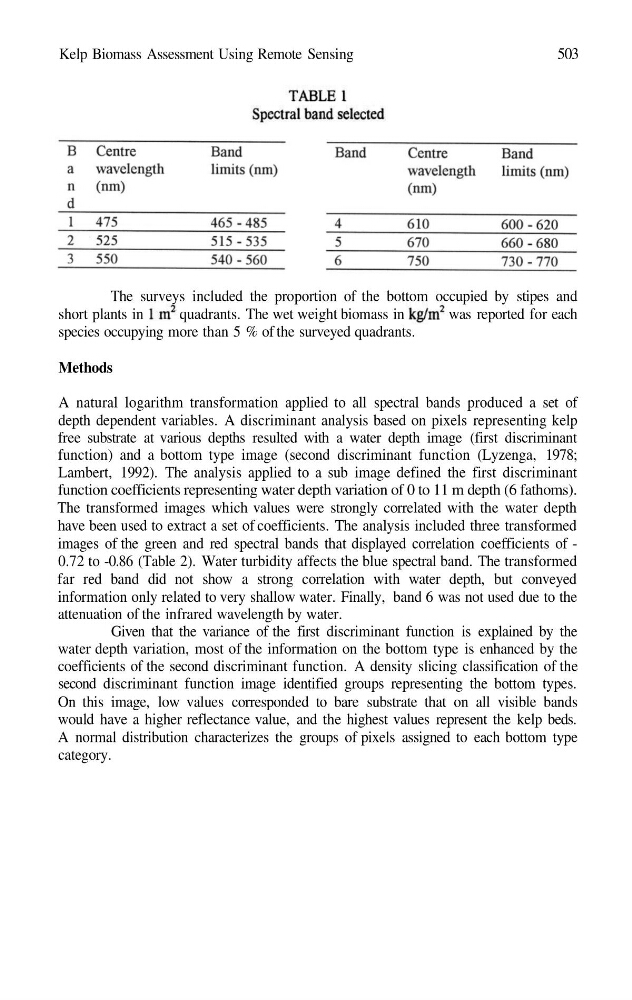
have been used to extract a set of coefficients. The analysis included three transformed
images of the green and red spectral bands that displayed correlation coefficients of -
0.72 to -0.86 (Table 2). Water turbidity affects the blue spectral band. The transformed
far red band did not show a strong correlation with water depth, but conveyed
information only related to very shallow water. Finally, band 6 was not used due to the
attenuation of the infrared wavelength by water.
Given that the variance of the first discriminant function is explained by the
water depth variation, most of the information on the bottom type is enhanced by the
coefficients of the second discriminant function. A density slicing classification of the
second discriminant function image identified groups representing the bottom types.
On this image, low values corresponded to bare substrate that on all visible bands
would have a higher reflectance value, and the highest values represent the kelp beds.
A normal distribution characterizes the groups of pixels assigned to each bottom type
category.
Kelp Biomass Assessment Using Remote Sensing
The surveys included the proportion of the bottom occupied by stipes and
short plants in
quadrants. The wet weight biomass in
was reported for each
species occupying more than 5 % of the surveyed quadrants.
Methods
A natural logarithm transformation applied to all spectral bands produced a set of
depth dependent variables. A discriminant analysis based on pixels representing kelp
free substrate at various depths resulted with a water depth image (first discriminant
function) and a bottom type image (second discriminant function (Lyzenga, 1978;
Lambert, 1992). The analysis applied to a sub image defined the first discriminant
function coefficients representing water depth variation of 0 to 11 m depth (6 fathoms).
The transformed images which values were strongly correlated with the water depth
have been used to extract a set of coefficients. The analysis included three transformed
images of the green and red spectral bands that displayed correlation coefficients of -
0.72 to -0.86 (Table 2). Water turbidity affects the blue spectral band. The transformed
far red band did not show a strong correlation with water depth, but conveyed
information only related to very shallow water. Finally, band 6 was not used due to the
attenuation of the infrared wavelength by water.
Given that the variance of the first discriminant function is explained by the
water depth variation, most of the information on the bottom type is enhanced by the
coefficients of the second discriminant function. A density slicing classification of the
second discriminant function image identified groups representing the bottom types.
On this image, low values corresponded to bare substrate that on all visible bands
would have a higher reflectance value, and the highest values represent the kelp beds.
A normal distribution characterizes the groups of pixels assigned to each bottom type
category.