

Constructing a Database of Coastal Change Using GIS
405
Most videography rigs are equipped with GPS position logging of the survey
plane’s flight. This record of GPS positions along the plane’s track at 1 second
intervals can be cross-correlated with the individual frames of the video either in realtime (for example using the Navtech Systems ‘Telenav’ unit - Cooper et al. (1996)) or
by post-processing (for example using a Horita time code generator - Brunner et al.
(1995)). The position fix and video data can be recorded for subsequent playback or
can be fed directly into a real-time plotting system such as RTGIS from AVL
(www.avxs.demon.co.uk). This allows the survey plane’s track to be plotted on a map:
since 25 video frames are captured for each GPS position (PAL video is 25 frames per
second), each plotted point will correspond to a specific video frame.
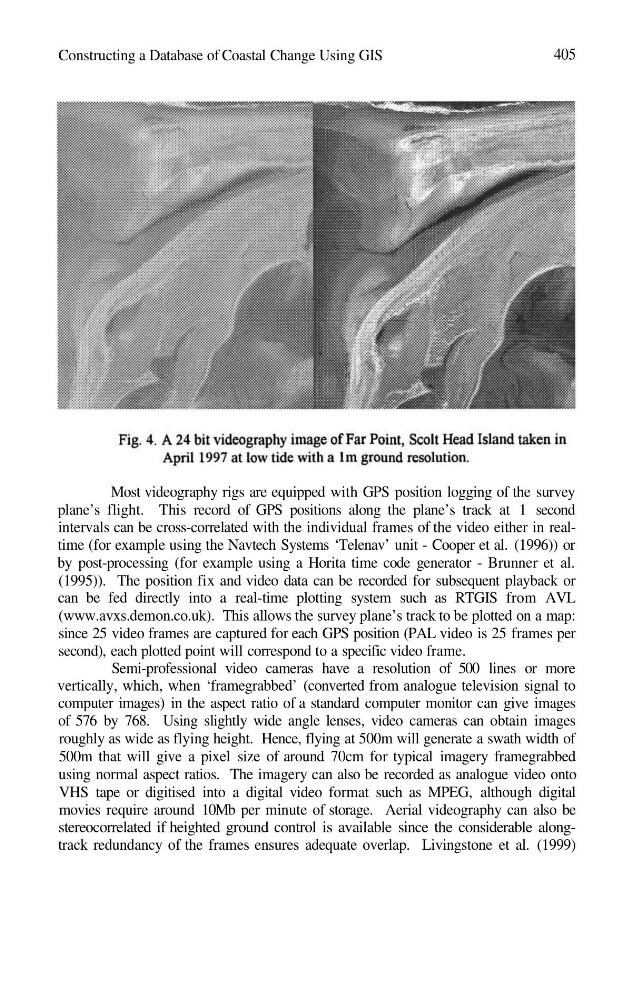
Semi-professional video cameras have a resolution of 500 lines or more
vertically, which, when ‘framegrabbed’ (converted from analogue television signal to
computer images) in the aspect ratio of a standard computer monitor can give images
of 576 by 768. Using slightly wide angle lenses, video cameras can obtain images
roughly as wide as flying height. Hence, flying at 500m will generate a swath width of
500m that will give a pixel size of around 70cm for typical imagery framegrabbed
using normal aspect ratios. The imagery can also be recorded as analogue video onto
VHS tape or digitised into a digital video format such as MPEG, although digital
movies require around 10Mb per minute of storage. Aerial videography can also be
stereocorrelated if heighted ground control is available since the considerable alongtrack redundancy of the frames ensures adequate overlap. Livingstone et al. (1999)
405
Most videography rigs are equipped with GPS position logging of the survey
plane’s flight. This record of GPS positions along the plane’s track at 1 second
intervals can be cross-correlated with the individual frames of the video either in realtime (for example using the Navtech Systems ‘Telenav’ unit - Cooper et al. (1996)) or
by post-processing (for example using a Horita time code generator - Brunner et al.
(1995)). The position fix and video data can be recorded for subsequent playback or
can be fed directly into a real-time plotting system such as RTGIS from AVL
(www.avxs.demon.co.uk). This allows the survey plane’s track to be plotted on a map:
since 25 video frames are captured for each GPS position (PAL video is 25 frames per
second), each plotted point will correspond to a specific video frame.
Semi-professional video cameras have a resolution of 500 lines or more
vertically, which, when ‘framegrabbed’ (converted from analogue television signal to
computer images) in the aspect ratio of a standard computer monitor can give images
of 576 by 768. Using slightly wide angle lenses, video cameras can obtain images
roughly as wide as flying height. Hence, flying at 500m will generate a swath width of
500m that will give a pixel size of around 70cm for typical imagery framegrabbed
using normal aspect ratios. The imagery can also be recorded as analogue video onto
VHS tape or digitised into a digital video format such as MPEG, although digital
movies require around 10Mb per minute of storage. Aerial videography can also be
stereocorrelated if heighted ground control is available since the considerable alongtrack redundancy of the frames ensures adequate overlap. Livingstone et al. (1999)