

GIS and Aquaculture: Soft-Shell Clam Site Assessment
289
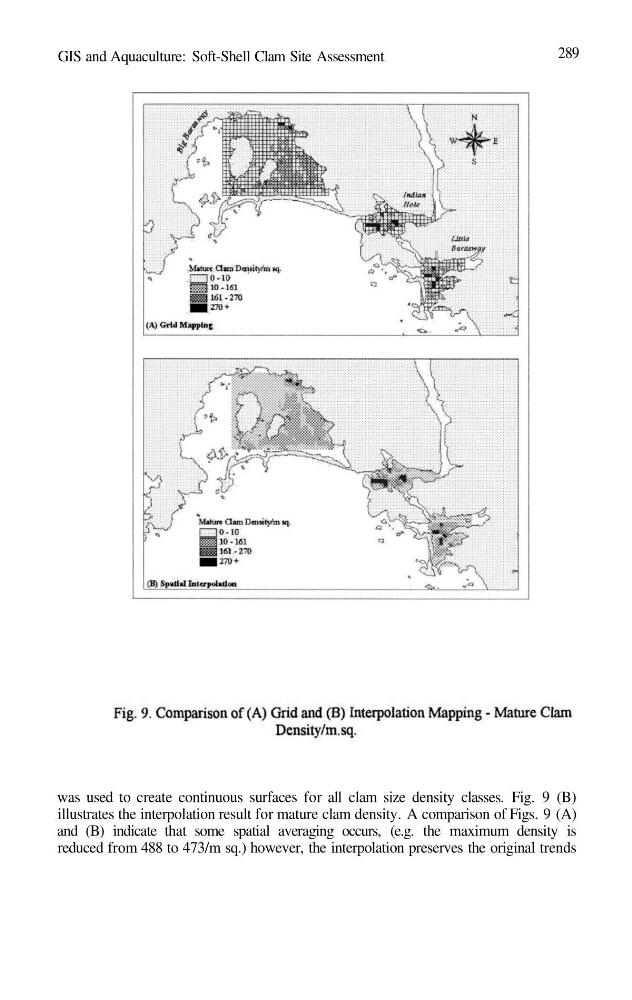
was used to create continuous surfaces for all clam size density classes. Fig. 9 (B)
illustrates the interpolation result for mature clam density. A comparison of Figs. 9 (A)
and (B) indicate that some spatial averaging occurs, (e.g. the maximum density is
reduced from 488 to 473/m sq.) however, the interpolation preserves the original trends
289
was used to create continuous surfaces for all clam size density classes. Fig. 9 (B)
illustrates the interpolation result for mature clam density. A comparison of Figs. 9 (A)
and (B) indicate that some spatial averaging occurs, (e.g. the maximum density is
reduced from 488 to 473/m sq.) however, the interpolation preserves the original trends