

Wanless et al.
230
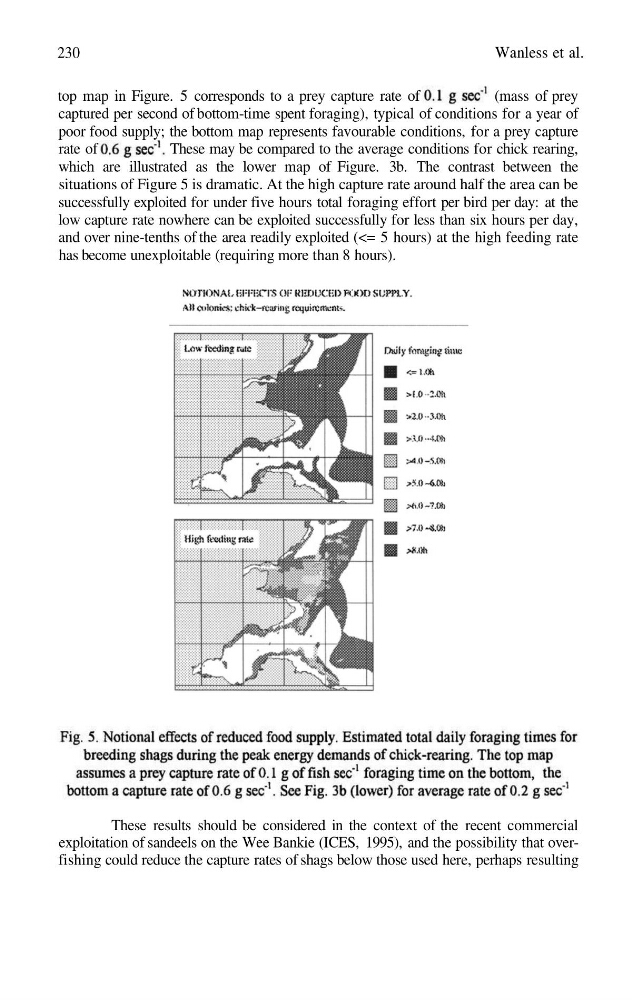
top map in Figure. 5 corresponds to a prey capture rate of
(mass of prey
captured per second of bottom-time spent foraging), typical of conditions for a year of
poor food supply; the bottom map represents favourable conditions, for a prey capture
rate of
These may be compared to the average conditions for chick rearing,
which are illustrated as the lower map of Figure. 3b. The contrast between the
situations of Figure 5 is dramatic. At the high capture rate around half the area can be
successfully exploited for under five hours total foraging effort per bird per day: at the
low capture rate nowhere can be exploited successfully for less than six hours per day,
and over nine-tenths of the area readily exploited (<= 5 hours) at the high feeding rate
has become unexploitable (requiring more than 8 hours).
These results should be considered in the context of the recent commercial
exploitation of sandeels on the Wee Bankie (ICES, 1995), and the possibility that overfishing could reduce the capture rates of shags below those used here, perhaps resulting
230
top map in Figure. 5 corresponds to a prey capture rate of
(mass of prey
captured per second of bottom-time spent foraging), typical of conditions for a year of
poor food supply; the bottom map represents favourable conditions, for a prey capture
rate of
These may be compared to the average conditions for chick rearing,
which are illustrated as the lower map of Figure. 3b. The contrast between the
situations of Figure 5 is dramatic. At the high capture rate around half the area can be
successfully exploited for under five hours total foraging effort per bird per day: at the
low capture rate nowhere can be exploited successfully for less than six hours per day,
and over nine-tenths of the area readily exploited (<= 5 hours) at the high feeding rate
has become unexploitable (requiring more than 8 hours).
These results should be considered in the context of the recent commercial
exploitation of sandeels on the Wee Bankie (ICES, 1995), and the possibility that overfishing could reduce the capture rates of shags below those used here, perhaps resulting