

198
Newsham et al.
Calculation of Sediment Yields by Lithology
The subsequent behaviour of the sediments after erosion from the cliff and shoreface is
to a large part dependent on its mineralogy and grain size. Sand and gravel contributes
to the beach and is moved southward by longshore drift. Mud is transported
southwards mainly in suspension in the nearshore waters. It is necessary to determine
the relative contribution of different size categories from the eroding shoreline in order
to properly assess the impacts of any future changes in the sediment budget.
The horizontal geological sections have been used to determine these
contributions. For this study it has been assumed that each formation is vertically and
laterally consistent enough that a single average composition can be assigned to each.
The section has been divided into ‘cells’ bounded by the locations of the recession rate
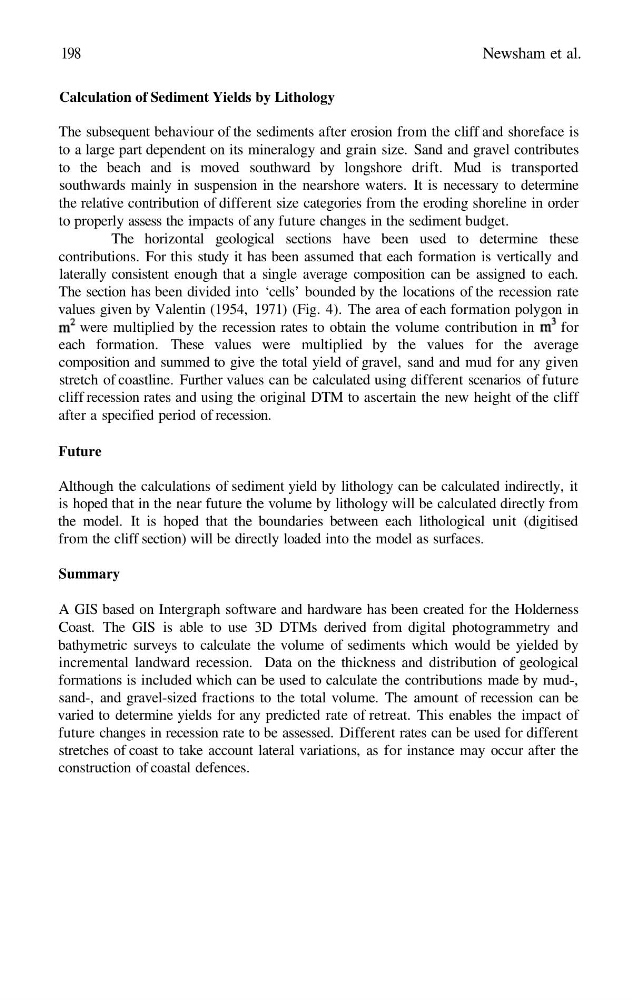
values given by Valentin (1954, 1971) (Fig. 4). The area of each formation polygon in
were multiplied by the recession rates to obtain the volume contribution in
for
each formation. These values were multiplied by the values for the average
composition and summed to give the total yield of gravel, sand and mud for any given
stretch of coastline. Further values can be calculated using different scenarios of future
cliff recession rates and using the original DTM to ascertain the new height of the cliff
after a specified period of recession.
Future
Although the calculations of sediment yield by lithology can be calculated indirectly, it
is hoped that in the near future the volume by lithology will be calculated directly from
the model. It is hoped that the boundaries between each lithological unit (digitised
from the cliff section) will be directly loaded into the model as surfaces.
Summary
A GIS based on Intergraph software and hardware has been created for the Holderness
Coast. The GIS is able to use 3D DTMs derived from digital photogrammetry and
bathymetric surveys to calculate the volume of sediments which would be yielded by
incremental landward recession. Data on the thickness and distribution of geological
formations is included which can be used to calculate the contributions made by mud-,
sand-, and gravel-sized fractions to the total volume. The amount of recession can be
varied to determine yields for any predicted rate of retreat. This enables the impact of
future changes in recession rate to be assessed. Different rates can be used for different
stretches of coast to take account lateral variations, as for instance may occur after the
construction of coastal defences.
Newsham et al.
Calculation of Sediment Yields by Lithology
The subsequent behaviour of the sediments after erosion from the cliff and shoreface is
to a large part dependent on its mineralogy and grain size. Sand and gravel contributes
to the beach and is moved southward by longshore drift. Mud is transported
southwards mainly in suspension in the nearshore waters. It is necessary to determine
the relative contribution of different size categories from the eroding shoreline in order
to properly assess the impacts of any future changes in the sediment budget.
The horizontal geological sections have been used to determine these
contributions. For this study it has been assumed that each formation is vertically and
laterally consistent enough that a single average composition can be assigned to each.
The section has been divided into ‘cells’ bounded by the locations of the recession rate
values given by Valentin (1954, 1971) (Fig. 4). The area of each formation polygon in
were multiplied by the recession rates to obtain the volume contribution in
for
each formation. These values were multiplied by the values for the average
composition and summed to give the total yield of gravel, sand and mud for any given
stretch of coastline. Further values can be calculated using different scenarios of future
cliff recession rates and using the original DTM to ascertain the new height of the cliff
after a specified period of recession.
Future
Although the calculations of sediment yield by lithology can be calculated indirectly, it
is hoped that in the near future the volume by lithology will be calculated directly from
the model. It is hoped that the boundaries between each lithological unit (digitised
from the cliff section) will be directly loaded into the model as surfaces.
Summary
A GIS based on Intergraph software and hardware has been created for the Holderness
Coast. The GIS is able to use 3D DTMs derived from digital photogrammetry and
bathymetric surveys to calculate the volume of sediments which would be yielded by
incremental landward recession. Data on the thickness and distribution of geological
formations is included which can be used to calculate the contributions made by mud-,
sand-, and gravel-sized fractions to the total volume. The amount of recession can be
varied to determine yields for any predicted rate of retreat. This enables the impact of
future changes in recession rate to be assessed. Different rates can be used for different
stretches of coast to take account lateral variations, as for instance may occur after the
construction of coastal defences.