

178
L. P. Humphries and C. N. Ligdas
distance from the centre of a panel in terms of depth and the width to height
(Subsidence Engineers Handbook, 1975). The subsidence and strain profiles are then
drawn for each seam.
Active subsidence after excavation takes place after the face has advanced.
This is almost fully developed after the face has advanced a distance about equal to the
draw beyond the surface points to be examined. The angle of draw (which predicts the
area on the surface influenced by the subsiding panel) from both panels covers the
beach area so it is reasonable to assume that the beach has been affected by subsidence
from both panels and probably within a year of cessation of excavation.
Fig. 7 is an example of a subsidence and strain profile calculated for two
worked panels underlying the cliffs and the nearshore zone at Dawdon Blast beach.
The strain and subsidence profiles were calculated, using charts from the Subsidence
Engineer’s Handbook, for values from just one seam, Main, for a range of survey data.
Main was the seam worked most recently (1988) and the seam nearest the surface
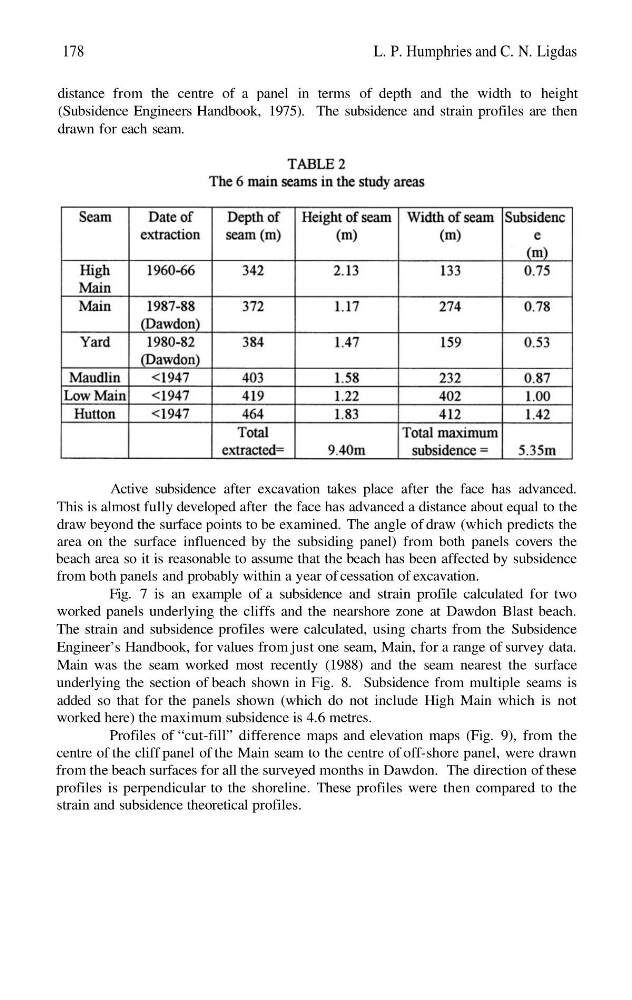
underlying the section of beach shown in Fig. 8. Subsidence from multiple seams is
added so that for the panels shown (which do not include High Main which is not
worked here) the maximum subsidence is 4.6 metres.
Profiles of “cut-fill” difference maps and elevation maps (Fig. 9), from the
centre of the cliff panel of the Main seam to the centre of off-shore panel, were drawn
from the beach surfaces for all the surveyed months in Dawdon. The direction of these
profiles is perpendicular to the shoreline. These profiles were then compared to the
strain and subsidence theoretical profiles.
L. P. Humphries and C. N. Ligdas
distance from the centre of a panel in terms of depth and the width to height
(Subsidence Engineers Handbook, 1975). The subsidence and strain profiles are then
drawn for each seam.
Active subsidence after excavation takes place after the face has advanced.
This is almost fully developed after the face has advanced a distance about equal to the
draw beyond the surface points to be examined. The angle of draw (which predicts the
area on the surface influenced by the subsiding panel) from both panels covers the
beach area so it is reasonable to assume that the beach has been affected by subsidence
from both panels and probably within a year of cessation of excavation.
Fig. 7 is an example of a subsidence and strain profile calculated for two
worked panels underlying the cliffs and the nearshore zone at Dawdon Blast beach.
The strain and subsidence profiles were calculated, using charts from the Subsidence
Engineer’s Handbook, for values from just one seam, Main, for a range of survey data.
Main was the seam worked most recently (1988) and the seam nearest the surface
underlying the section of beach shown in Fig. 8. Subsidence from multiple seams is
added so that for the panels shown (which do not include High Main which is not
worked here) the maximum subsidence is 4.6 metres.
Profiles of “cut-fill” difference maps and elevation maps (Fig. 9), from the
centre of the cliff panel of the Main seam to the centre of off-shore panel, were drawn
from the beach surfaces for all the surveyed months in Dawdon. The direction of these
profiles is perpendicular to the shoreline. These profiles were then compared to the
strain and subsidence theoretical profiles.