

36 Marine Macro- and Microalgae: An Overview
(up to 1 mm accuracy). Using elemental analyses for each seaweed species, the carbon sink (CO 2
equivalent) was estimated based on wet and dry weights. The composition of elements is not shown.
During the construction of the pilot seaweed farm, CO 2 in the ocean was taken up through
photosynthesis. Because the atmosphere and ocean are in a state of equilibrium, any carbon sequestered
by these plants would contribute to the reduction in atmospheric CO 2 . This was based on the following
principle: if the movement of CO 2 between the atmosphere and ocean surface is in balance, then its
removal from the ocean (water column) is the same as the amount removed from the atmosphere.
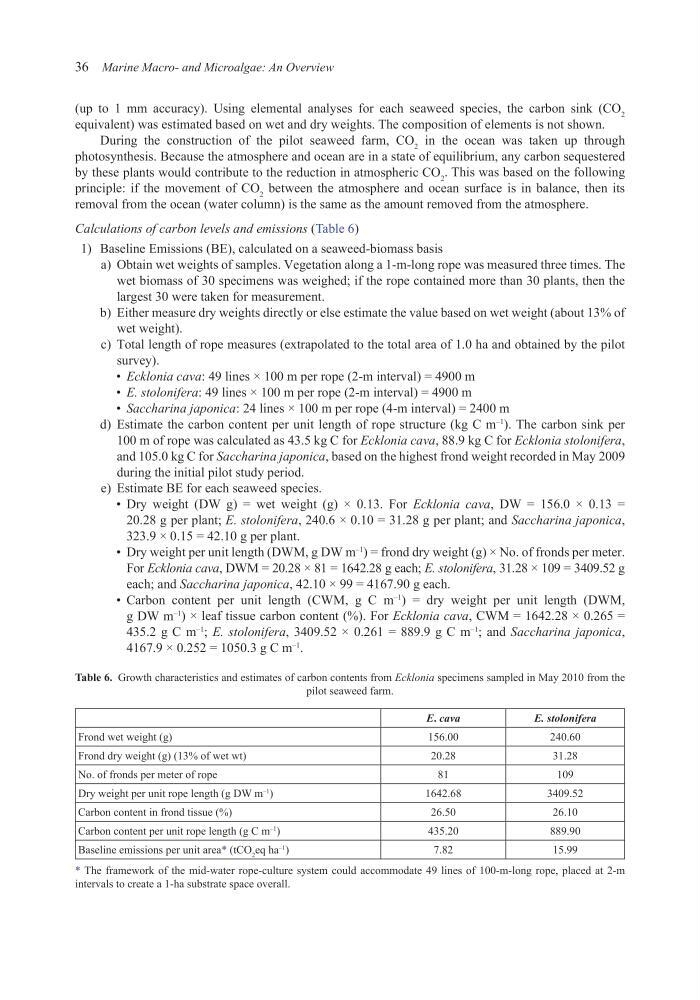
Calculations of carbon levels and emissions (Table 6)
1) Baseline Emissions (BE), calculated on a seaweed-biomass basis
a) Obtain wet weights of samples. Vegetation along a 1-m-long rope was measured three times. The
wet biomass of 30 specimens was weighed; if the rope contained more than 30 plants, then the
largest 30 were taken for measurement.
b) Either measure dry weights directly or else estimate the value based on wet weight (about 13% of
wet weight).
c) Total length of rope measures (extrapolated to the total area of 1.0 ha and obtained by the pilot
survey).
• Ecklonia cava: 49 lines × 100 m per rope (2-m interval) = 4900 m
• E. stolonifera: 49 lines × 100 m per rope (2-m interval) = 4900 m
• Saccharina japonica: 24 lines × 100 m per rope (4-m interval) = 2400 m
d) Estimate the carbon content per unit length of rope structure (kg C m
–1
). The carbon sink per
100 m of rope was calculated as 43.5 kg C for Ecklonia cava, 88.9 kg C for Ecklonia stolonifera,
and 105.0 kg C for Saccharina japonica, based on the highest frond weight recorded in May 2009
during the initial pilot study period.
e) Estimate BE for each seaweed species.
• Dry weight (DW g) = wet weight (g) × 0.13. For Ecklonia cava, DW = 156.0 × 0.13 =
20.28 g per plant; E. stolonifera, 240.6 × 0.10 = 31.28 g per plant; and Saccharina japonica,
323.9 × 0.15 = 42.10 g per plant.
• Dry weight per unit length (DWM, g DW m
–1
) = frond dry weight (g) × No. of fronds per meter.
For Ecklonia cava, DWM = 20.28 × 81 = 1642.28 g each; E. stolonifera, 31.28 × 109 = 3409.52 g
each; and Saccharina japonica, 42.10 × 99 = 4167.90 g each.
• Carbon content per unit length (CWM, g C m
–1
) = dry weight per unit length (DWM,
g DW m
–1
) × leaf tissue carbon content (%). For Ecklonia cava, CWM = 1642.28 × 0.265 =
435.2 g C m
–1
; E. stolonifera, 3409.52 × 0.261 = 889.9 g C m
–1
; and Saccharina japonica,
4167.9 × 0.252 = 1050.3 g C m
–1
.
Table 6. Growth characteristics and estimates of carbon contents from Ecklonia specimens sampled in May 2010 from the
pilot seaweed farm.
E. cava
E. stolonifera
Frond wet weight (g)
156.00
240.60
Frond dry weight (g) (13% of wet wt)
20.28
31.28
No. of fronds per meter of rope
81
109
Dry weight per unit rope length (g DW m
–1
)
1642.68
3409.52
Carbon content in frond tissue (%)
26.50
26.10
Carbon content per unit rope length (g C m
–1
)
435.20
889.90
Baseline emissions per unit area* (tCO 2 eq ha
–1
)
7.82
15.99
* The framework of the mid-water rope-culture system could accommodate 49 lines of 100-m-long rope, placed at 2-m
intervals to create a 1-ha substrate space overall.
(up to 1 mm accuracy). Using elemental analyses for each seaweed species, the carbon sink (CO 2
equivalent) was estimated based on wet and dry weights. The composition of elements is not shown.
During the construction of the pilot seaweed farm, CO 2 in the ocean was taken up through
photosynthesis. Because the atmosphere and ocean are in a state of equilibrium, any carbon sequestered
by these plants would contribute to the reduction in atmospheric CO 2 . This was based on the following
principle: if the movement of CO 2 between the atmosphere and ocean surface is in balance, then its
removal from the ocean (water column) is the same as the amount removed from the atmosphere.
Calculations of carbon levels and emissions (Table 6)
1) Baseline Emissions (BE), calculated on a seaweed-biomass basis
a) Obtain wet weights of samples. Vegetation along a 1-m-long rope was measured three times. The
wet biomass of 30 specimens was weighed; if the rope contained more than 30 plants, then the
largest 30 were taken for measurement.
b) Either measure dry weights directly or else estimate the value based on wet weight (about 13% of
wet weight).
c) Total length of rope measures (extrapolated to the total area of 1.0 ha and obtained by the pilot
survey).
• Ecklonia cava: 49 lines × 100 m per rope (2-m interval) = 4900 m
• E. stolonifera: 49 lines × 100 m per rope (2-m interval) = 4900 m
• Saccharina japonica: 24 lines × 100 m per rope (4-m interval) = 2400 m
d) Estimate the carbon content per unit length of rope structure (kg C m
–1
). The carbon sink per
100 m of rope was calculated as 43.5 kg C for Ecklonia cava, 88.9 kg C for Ecklonia stolonifera,
and 105.0 kg C for Saccharina japonica, based on the highest frond weight recorded in May 2009
during the initial pilot study period.
e) Estimate BE for each seaweed species.
• Dry weight (DW g) = wet weight (g) × 0.13. For Ecklonia cava, DW = 156.0 × 0.13 =
20.28 g per plant; E. stolonifera, 240.6 × 0.10 = 31.28 g per plant; and Saccharina japonica,
323.9 × 0.15 = 42.10 g per plant.
• Dry weight per unit length (DWM, g DW m
–1
) = frond dry weight (g) × No. of fronds per meter.
For Ecklonia cava, DWM = 20.28 × 81 = 1642.28 g each; E. stolonifera, 31.28 × 109 = 3409.52 g
each; and Saccharina japonica, 42.10 × 99 = 4167.90 g each.
• Carbon content per unit length (CWM, g C m
–1
) = dry weight per unit length (DWM,
g DW m
–1
) × leaf tissue carbon content (%). For Ecklonia cava, CWM = 1642.28 × 0.265 =
435.2 g C m
–1
; E. stolonifera, 3409.52 × 0.261 = 889.9 g C m
–1
; and Saccharina japonica,
4167.9 × 0.252 = 1050.3 g C m
–1
.
Table 6. Growth characteristics and estimates of carbon contents from Ecklonia specimens sampled in May 2010 from the
pilot seaweed farm.
E. cava
E. stolonifera
Frond wet weight (g)
156.00
240.60
Frond dry weight (g) (13% of wet wt)
20.28
31.28
No. of fronds per meter of rope
81
109
Dry weight per unit rope length (g DW m
–1
)
1642.68
3409.52
Carbon content in frond tissue (%)
26.50
26.10
Carbon content per unit rope length (g C m
–1
)
435.20
889.90
Baseline emissions per unit area* (tCO 2 eq ha
–1
)
7.82
15.99
* The framework of the mid-water rope-culture system could accommodate 49 lines of 100-m-long rope, placed at 2-m
intervals to create a 1-ha substrate space overall.