

32 Marine Macro- and Microalgae: An Overview
Currently, property upon which the ocean substrate was to be used for new afforestation along the project
boundary was similar to degraded coastal areas that contained seaweed, grass, and shrub species. This
pilot project began on 1 May 2009; no construction of seaweed vegetation on artificial substrates had
occurred before that date.
Step 1: Identification of alternative scenarios consistent with a legal and regulatory framework
Because this project was economically unattractive and entailed several financial, technical, and
institutional barriers, as well as market risks, one could realize its reality, feasibility, and applicability
only through consistent use of a marine substrate. Otherwise, the quality of this marine environment
would be degraded to the point that it was classified as barren ground. Due to grazing by species such as
sea urchins, snails, and sea stars, it had been difficult for seaweed to grow and reproduce naturally. Thus,
a native seaweed forest similar to one obtained via this project could not otherwise occur. Some national
and regional programs have already been implemented for six or seven years. Whether the goals of many
such programs can be met depends upon the availability of financial resources. Domestic funding for
construction and restoration of seaweed forests has long been limited, and has been concentrated in areas
considered more economically viable and efficient rather than being used for addressing the conditions
found in this project area. The baseline scenario satisfies current and foreseeable-future requirements that
are entirely applicable, legitimate, and open to regulation.
Step 2: Investment Analysis
Sub-step 2a. Determine the appropriate method for analysis. In the case of proven alternatives (such as
maintaining the current situation), additional investments are not required and do not provide economic
benefits. We selected IRR as an economic indicator for analyzing the benchmarks in this project.
Sub-step 2b. Option III: Apply benchmark analysis. The required return on stocks within the agriculture
investment business is 12%, based on standard values issued by Chinese special agencies in 2012. This
means that the government will approve a project only when the IRR is above this minimum return.
These standard values are typically treated as a reference point for private investment and commercial
afforestation.
Sub-step 2c. Calculate and compare financial indicators. The task of “nursery operations” occurred
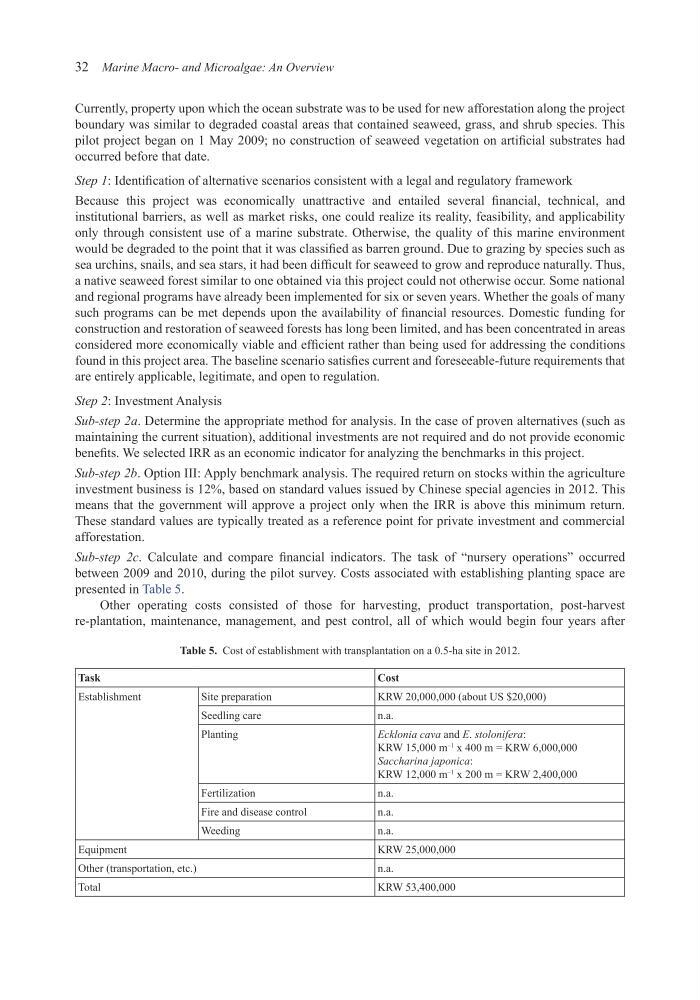
between 2009 and 2010, during the pilot survey. Costs associated with establishing planting space are
presented in Table 5.
Other operating costs consisted of those for harvesting, product transportation, post-harvest
re-plantation, maintenance, management, and pest control, all of which would begin four years after
Table 5. Cost of establishment with transplantation on a 0.5-ha site in 2012.
Task
Cost
Establishment
Site preparation
KRW 20,000,000 (about US $20,000)
Seedling care
n.a.
Planting
Ecklonia cava and E. stolonifera:
KRW 15,000 m
–1
x 400 m = KRW 6,000,000
Saccharina japonica:
KRW 12,000 m
–1
x 200 m = KRW 2,400,000
Fertilization
n.a.
Fire and disease control
n.a.
Weeding
n.a.
Equipment
KRW 25,000,000
Other (transportation, etc.)
n.a.
Total
KRW 53,400,000
Currently, property upon which the ocean substrate was to be used for new afforestation along the project
boundary was similar to degraded coastal areas that contained seaweed, grass, and shrub species. This
pilot project began on 1 May 2009; no construction of seaweed vegetation on artificial substrates had
occurred before that date.
Step 1: Identification of alternative scenarios consistent with a legal and regulatory framework
Because this project was economically unattractive and entailed several financial, technical, and
institutional barriers, as well as market risks, one could realize its reality, feasibility, and applicability
only through consistent use of a marine substrate. Otherwise, the quality of this marine environment
would be degraded to the point that it was classified as barren ground. Due to grazing by species such as
sea urchins, snails, and sea stars, it had been difficult for seaweed to grow and reproduce naturally. Thus,
a native seaweed forest similar to one obtained via this project could not otherwise occur. Some national
and regional programs have already been implemented for six or seven years. Whether the goals of many
such programs can be met depends upon the availability of financial resources. Domestic funding for
construction and restoration of seaweed forests has long been limited, and has been concentrated in areas
considered more economically viable and efficient rather than being used for addressing the conditions
found in this project area. The baseline scenario satisfies current and foreseeable-future requirements that
are entirely applicable, legitimate, and open to regulation.
Step 2: Investment Analysis
Sub-step 2a. Determine the appropriate method for analysis. In the case of proven alternatives (such as
maintaining the current situation), additional investments are not required and do not provide economic
benefits. We selected IRR as an economic indicator for analyzing the benchmarks in this project.
Sub-step 2b. Option III: Apply benchmark analysis. The required return on stocks within the agriculture
investment business is 12%, based on standard values issued by Chinese special agencies in 2012. This
means that the government will approve a project only when the IRR is above this minimum return.
These standard values are typically treated as a reference point for private investment and commercial
afforestation.
Sub-step 2c. Calculate and compare financial indicators. The task of “nursery operations” occurred
between 2009 and 2010, during the pilot survey. Costs associated with establishing planting space are
presented in Table 5.
Other operating costs consisted of those for harvesting, product transportation, post-harvest
re-plantation, maintenance, management, and pest control, all of which would begin four years after
Table 5. Cost of establishment with transplantation on a 0.5-ha site in 2012.
Task
Cost
Establishment
Site preparation
KRW 20,000,000 (about US $20,000)
Seedling care
n.a.
Planting
Ecklonia cava and E. stolonifera:
KRW 15,000 m
–1
x 400 m = KRW 6,000,000
Saccharina japonica:
KRW 12,000 m
–1
x 200 m = KRW 2,400,000
Fertilization
n.a.
Fire and disease control
n.a.
Weeding
n.a.
Equipment
KRW 25,000,000
Other (transportation, etc.)
n.a.
Total
KRW 53,400,000