

264
Air Pollution and Turbulence: Modeling and Applications
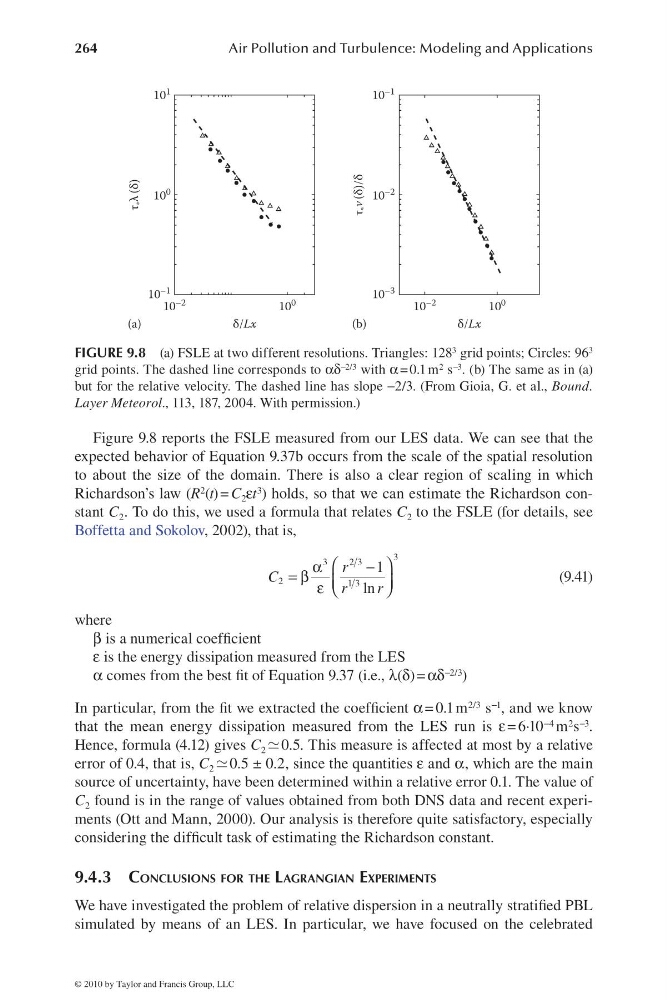
Figure 9.8 reports the FSLE measured from our LES data. We can see that the
expected behavior of Equation 9.37b occurs from the scale of the spatial resolution
to about the size of the domain. There is also a clear region of scaling in which
Richardson’s law (R 2 (t) = C 2 εt 3 ) holds, so that we can estimate the Richardson constant C 2 . To do this, we used a formula that relates C 2 to the FSLE (for details, see
Boffetta and Sokolov, 2002), that is,
3
3
23
2
1 3
1
ln
r
C
r
r
⎛
⎞
α
−
= β ⎜
⎟
ε ⎝
⎠
(9.41)
where
β is a numerical coeffi cient
ε is the energy dissipation measured from the LES
α comes from the best fi t of Equation 9.37 (i.e., λ(δ) = αδ −2/3 )
In particular, from the fi t we extracted the coeffi cient α = 0.1 m 2/3 s −1 , and we know
that the mean energy dissipation measured from the LES run is ε = 6·10 −4 m 2 s −3 .
Hence, formula (4.12) gives C 2 0.5. This measure is affected at most by a relative
error of 0.4, that is, C 2 0.5 ± 0.2, since the quantities ε and α, which are the main
source of uncertainty, have been determined within a relative error 0.1. The value of
C 2 found is in the range of values obtained from both DNS data and recent experiments (Ott and Mann, 2000). Our analysis is therefore quite satisfactory, especially
considering the diffi cult task of estimating the Richardson constant.
9.4.3 CONCLUSIONS FOR THE LAGRANGIAN EXPERIMENTS
We have investigated the problem of relative dispersion in a neutrally stratifi ed PBL
simulated by means of an LES. In particular, we have focused on the celebrated
(a)
10
1
10
0
10
–1
10
–2
10
0
δ/Lx
τ
*
λ (δ)
(b)
10
–2
10
0
δ/Lx
10 –1
10
–2
10
–3
τ
*
v (δ)/δ
FIGURE 9.8 (a) FSLE at two different resolutions. Triangles: 128 3 grid points; Circles: 96 3
grid points. The dashed line corresponds to αδ −2/3 with α = 0.1 m 2 s −3 . (b) The same as in (a)
but for the relative velocity. The dashed line has slope −2/3. (From Gioia, G. et al., Bound.
Layer Meteorol., 113, 187, 2004. With permission.)
© 2010 by Taylor and Francis Group, LLC
Air Pollution and Turbulence: Modeling and Applications
Figure 9.8 reports the FSLE measured from our LES data. We can see that the
expected behavior of Equation 9.37b occurs from the scale of the spatial resolution
to about the size of the domain. There is also a clear region of scaling in which
Richardson’s law (R 2 (t) = C 2 εt 3 ) holds, so that we can estimate the Richardson constant C 2 . To do this, we used a formula that relates C 2 to the FSLE (for details, see
Boffetta and Sokolov, 2002), that is,
3
3
23
2
1 3
1
ln
r
C
r
r
⎛
⎞
α
−
= β ⎜
⎟
ε ⎝
⎠
(9.41)
where
β is a numerical coeffi cient
ε is the energy dissipation measured from the LES
α comes from the best fi t of Equation 9.37 (i.e., λ(δ) = αδ −2/3 )
In particular, from the fi t we extracted the coeffi cient α = 0.1 m 2/3 s −1 , and we know
that the mean energy dissipation measured from the LES run is ε = 6·10 −4 m 2 s −3 .
Hence, formula (4.12) gives C 2 0.5. This measure is affected at most by a relative
error of 0.4, that is, C 2 0.5 ± 0.2, since the quantities ε and α, which are the main
source of uncertainty, have been determined within a relative error 0.1. The value of
C 2 found is in the range of values obtained from both DNS data and recent experiments (Ott and Mann, 2000). Our analysis is therefore quite satisfactory, especially
considering the diffi cult task of estimating the Richardson constant.
9.4.3 CONCLUSIONS FOR THE LAGRANGIAN EXPERIMENTS
We have investigated the problem of relative dispersion in a neutrally stratifi ed PBL
simulated by means of an LES. In particular, we have focused on the celebrated
(a)
10
1
10
0
10
–1
10
–2
10
0
δ/Lx
τ
*
λ (δ)
(b)
10
–2
10
0
δ/Lx
10 –1
10
–2
10
–3
τ
*
v (δ)/δ
FIGURE 9.8 (a) FSLE at two different resolutions. Triangles: 128 3 grid points; Circles: 96 3
grid points. The dashed line corresponds to αδ −2/3 with α = 0.1 m 2 s −3 . (b) The same as in (a)
but for the relative velocity. The dashed line has slope −2/3. (From Gioia, G. et al., Bound.
Layer Meteorol., 113, 187, 2004. With permission.)
© 2010 by Taylor and Francis Group, LLC