

Atmospheric Dispersion with a Large-Eddy Simulation
255
principally into a region covered almost entirely by updrafts. This is confi rmed by
Figure 9.5, which shows the isopleths of the adimensional crosswind-integrated concentration averaged over the last 3000 time steps. Figure 9.6 shows the adimensional
crosswind-integrated concentration at the surface from an elevated (Figure 9.6a) and
1.4
1.2
1.0
0.8
0.6
0.4
0.2
0.0
0.0
0.5
1.0
1.5
X *
z/h
2.0
2.5
3.0
0.60
0.40
0.80
1.4
1.6
1.8
1.0
1.2
0.20
(a)
1.4
1.2
1.0
0.8
0.6
z/h
0.4
0.60
1.2
1.6
1.4
1.8
3.2
2.0
2.6
1.0
1.4
1.6
0.40
0.80
0.20
1.2
1.8
2.0
0.2
0.0
0.0
(b)
0.5
1.0
1.5
X *
2.0
2.5
3.0
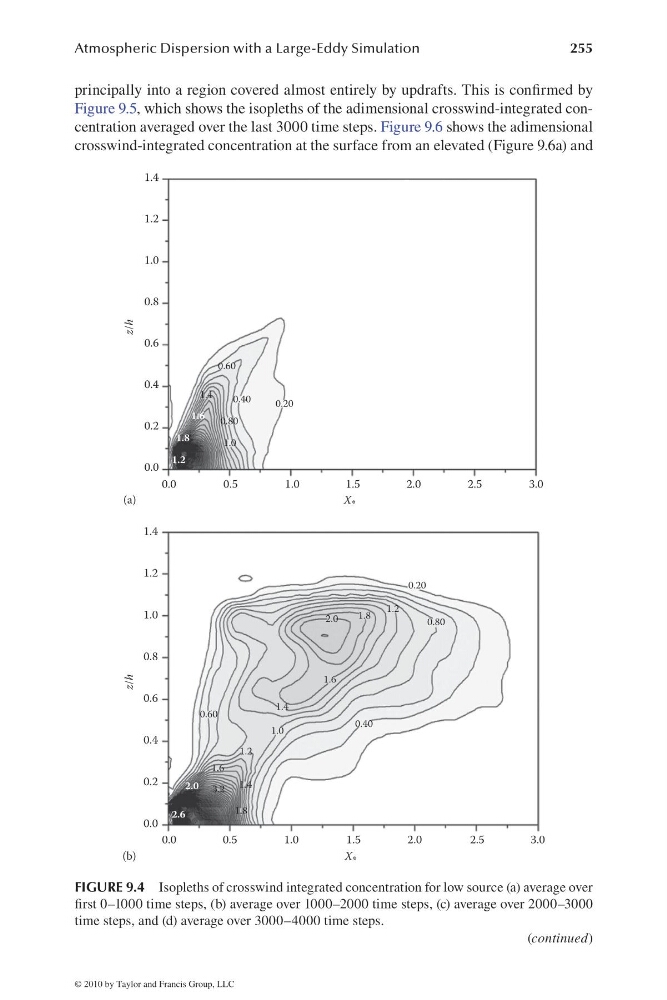
FIGURE 9.4 Isopleths of crosswind integrated concentration for low source (a) average over
fi rst 0–1000 time steps, (b) average over 1000–2000 time steps, (c) average over 2000–3000
time steps, and (d) average over 3000–4000 time steps.
(continued)
© 2010 by Taylor and Francis Group, LLC
255
principally into a region covered almost entirely by updrafts. This is confi rmed by
Figure 9.5, which shows the isopleths of the adimensional crosswind-integrated concentration averaged over the last 3000 time steps. Figure 9.6 shows the adimensional
crosswind-integrated concentration at the surface from an elevated (Figure 9.6a) and
1.4
1.2
1.0
0.8
0.6
0.4
0.2
0.0
0.0
0.5
1.0
1.5
X *
z/h
2.0
2.5
3.0
0.60
0.40
0.80
1.4
1.6
1.8
1.0
1.2
0.20
(a)
1.4
1.2
1.0
0.8
0.6
z/h
0.4
0.60
1.2
1.6
1.4
1.8
3.2
2.0
2.6
1.0
1.4
1.6
0.40
0.80
0.20
1.2
1.8
2.0
0.2
0.0
0.0
(b)
0.5
1.0
1.5
X *
2.0
2.5
3.0
FIGURE 9.4 Isopleths of crosswind integrated concentration for low source (a) average over
fi rst 0–1000 time steps, (b) average over 1000–2000 time steps, (c) average over 2000–3000
time steps, and (d) average over 3000–4000 time steps.
(continued)
© 2010 by Taylor and Francis Group, LLC