

An Outline of Lagrangian Stochastic Dispersion Models
223
when atmospheric pollutant dispersion is simulated over complex terrain or in urban
heat island, the turbulence input parameters are often prescribed according to standard parameterization based on surface layer quantities (see Section 8.7.1). However,
these parameterizations may be inadequate in predicting the turbulence fi eld in such
horizontally nonhomogeneous boundary layer, due to the essentially local nature of
the prescribed turbulence. SPRAY was used in the modeling system RMS. Different
and new turbulence closure schemes implemented in RAMS meteorological model
were used, in combination with alternative formulations for the Lagrangian turbulent
parameters in SPRAY. Their infl uence on the dispersion of the tracer could thus be
evaluated.
Predicted fi elds of velocity standard deviations and Lagrangian timescales
demonstrated to be able to take into account the inhomogeneities due to the valley.
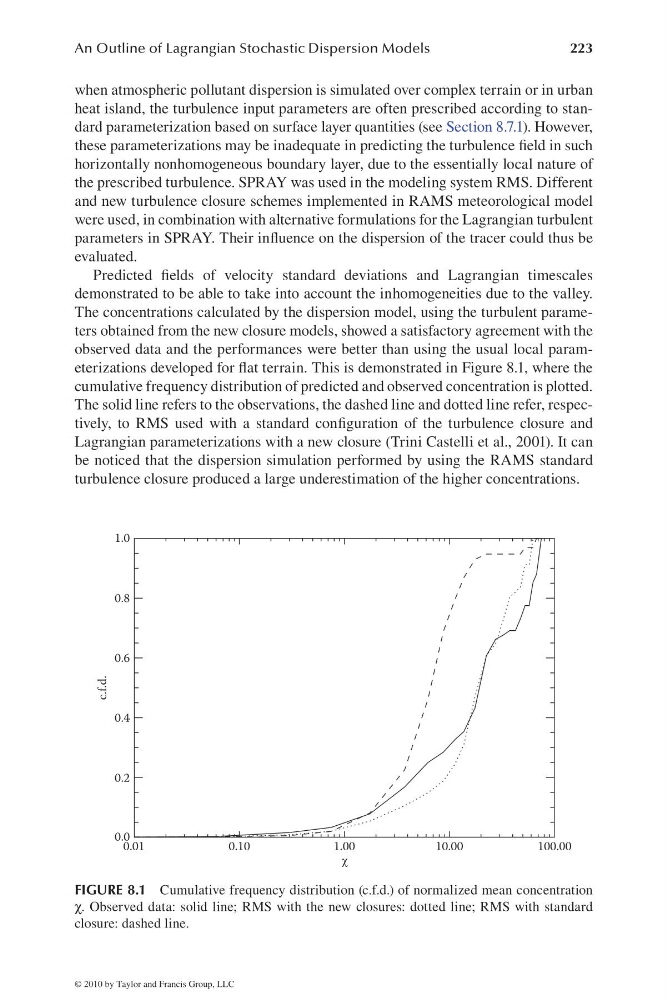
The concentrations calculated by the dispersion model, using the turbulent parameters obtained from the new closure models, showed a satisfactory agreement with the
observed data and the performances were better than using the usual local parameterizations developed for fl at terrain. This is demonstrated in Figure 8.1, where the
cumulative frequency distribution of predicted and observed concentration is plotted.
The solid line refers to the observations, the dashed line and dotted line refer, respectively, to RMS used with a standard confi guration of the turbulence closure and
Lagrangian parameterizations with a new closure (Trini Castelli et al., 2001). It can
be noticed that the dispersion simulation performed by using the RAMS standard
turbulence closure produced a large underestimation of the higher concentrations.
1.0
0.8
0.6
0.4
0.2
0.0
0.01
0.10
1.00
10.00
100.00
c.f.d.
FIGURE 8.1 Cumulative frequency distribution (c.f.d.) of normalized mean concentration
χ. Observed data: solid line; RMS with the new closures: dotted line; RMS with standard
closure: dashed line.
© 2010 by Taylor and Francis Group, LLC
223
when atmospheric pollutant dispersion is simulated over complex terrain or in urban
heat island, the turbulence input parameters are often prescribed according to standard parameterization based on surface layer quantities (see Section 8.7.1). However,
these parameterizations may be inadequate in predicting the turbulence fi eld in such
horizontally nonhomogeneous boundary layer, due to the essentially local nature of
the prescribed turbulence. SPRAY was used in the modeling system RMS. Different
and new turbulence closure schemes implemented in RAMS meteorological model
were used, in combination with alternative formulations for the Lagrangian turbulent
parameters in SPRAY. Their infl uence on the dispersion of the tracer could thus be
evaluated.
Predicted fi elds of velocity standard deviations and Lagrangian timescales
demonstrated to be able to take into account the inhomogeneities due to the valley.
The concentrations calculated by the dispersion model, using the turbulent parameters obtained from the new closure models, showed a satisfactory agreement with the
observed data and the performances were better than using the usual local parameterizations developed for fl at terrain. This is demonstrated in Figure 8.1, where the
cumulative frequency distribution of predicted and observed concentration is plotted.
The solid line refers to the observations, the dashed line and dotted line refer, respectively, to RMS used with a standard confi guration of the turbulence closure and
Lagrangian parameterizations with a new closure (Trini Castelli et al., 2001). It can
be noticed that the dispersion simulation performed by using the RAMS standard
turbulence closure produced a large underestimation of the higher concentrations.
1.0
0.8
0.6
0.4
0.2
0.0
0.01
0.10
1.00
10.00
100.00
c.f.d.
FIGURE 8.1 Cumulative frequency distribution (c.f.d.) of normalized mean concentration
χ. Observed data: solid line; RMS with the new closures: dotted line; RMS with standard
closure: dashed line.
© 2010 by Taylor and Francis Group, LLC