

Pollutant Dispersion Simulation in the ABL by the GILTT Method
195
experimental data and the GILTT method. Analyzing the statistical indices (Hanna,
1989), we notice that these models simulate satisfactorily the observed concentrations, regarding the NMSE, FB, and FS values relatively near to zero and COR
relatively near to 1.
7.5.3 IIT EXPERIMENT RESULTS
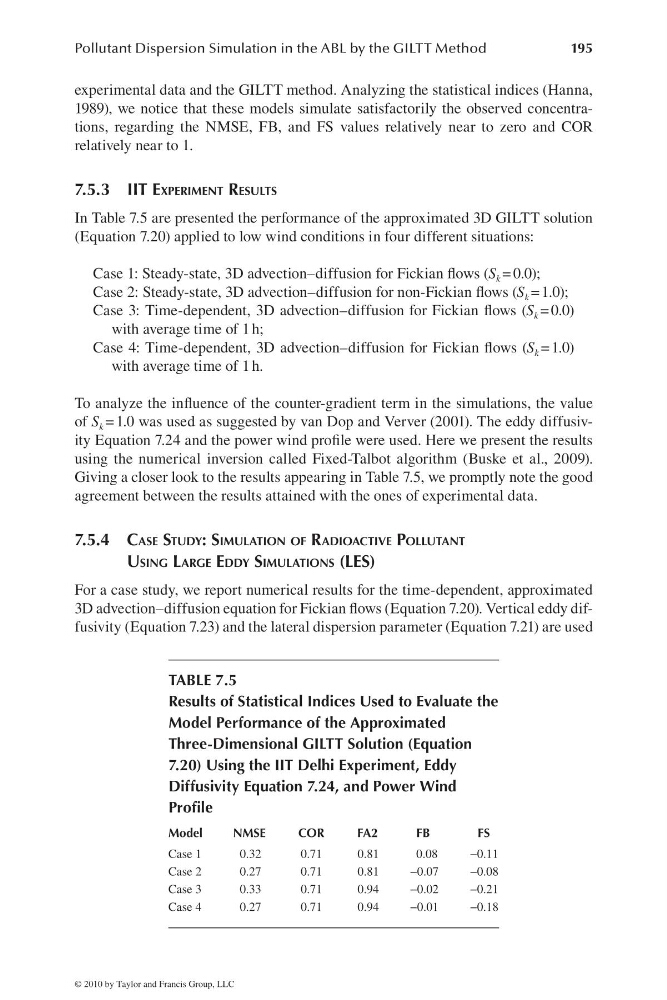
In Table 7.5 are presented the performance of the approximated 3D GILTT solution
(Equation 7.20) applied to low wind conditions in four different situations:
Case 1: Steady-state, 3D advection–diffusion for Fickian fl ows (S k = 0.0);
Case 2: Steady-state, 3D advection–diffusion for non-Fickian fl ows (S k = 1.0);
Case 3: Time-dependent, 3D advection–diffusion for Fickian fl ows (S k = 0.0)
with average time of 1 h;
Case 4: Time-dependent, 3D advection–diffusion for Fickian fl ows (S k = 1.0)
with average time of 1 h.
To analyze the infl uence of the counter-gradient term in the simulations, the value
of S k = 1.0 was used as suggested by van Dop and Verver (2001). The eddy diffusivity Equation 7.24 and the power wind profi le were used. Here we present the results
using the numerical inversion called Fixed-Talbot algorithm (Buske et al., 2009).
Giving a closer look to the results appearing in Table 7.5, we promptly note the good
agreement between the results attained with the ones of experimental data.
7.5.4 CASE STUDY: SIMULATION OF RADIOACTIVE POLLUTANT
USING LARGE EDDY SIMULATIONS (LES)
For a case study, we report numerical results for the time-dependent, approximated
3D advection–diffusion equation for Fickian fl ows (Equation 7.20). Vertical eddy diffusivity (Equation 7.23) and the lateral dispersion parameter (Equation 7.21) are used
TABLE 7.5
Results of Statistical Indices Used to Evaluate the
Model Performance of the Approximated
Three-Dimensional GILTT Solution (Equation
7.20) Using the IIT Delhi Experiment, Eddy
Diffusivity Equation 7.24, and Power Wind
Profi le
Model
NMSE
COR
FA2
FB
FS
Case 1
0.32
0.71
0.81
0.08
−0.11
Case 2
0.27
0.71
0.81
−0.07
−0.08
Case 3
0.33
0.71
0.94
−0.02
−0.21
Case 4
0.27
0.71
0.94
−0.01
−0.18
© 2010 by Taylor and Francis Group, LLC
195
experimental data and the GILTT method. Analyzing the statistical indices (Hanna,
1989), we notice that these models simulate satisfactorily the observed concentrations, regarding the NMSE, FB, and FS values relatively near to zero and COR
relatively near to 1.
7.5.3 IIT EXPERIMENT RESULTS
In Table 7.5 are presented the performance of the approximated 3D GILTT solution
(Equation 7.20) applied to low wind conditions in four different situations:
Case 1: Steady-state, 3D advection–diffusion for Fickian fl ows (S k = 0.0);
Case 2: Steady-state, 3D advection–diffusion for non-Fickian fl ows (S k = 1.0);
Case 3: Time-dependent, 3D advection–diffusion for Fickian fl ows (S k = 0.0)
with average time of 1 h;
Case 4: Time-dependent, 3D advection–diffusion for Fickian fl ows (S k = 1.0)
with average time of 1 h.
To analyze the infl uence of the counter-gradient term in the simulations, the value
of S k = 1.0 was used as suggested by van Dop and Verver (2001). The eddy diffusivity Equation 7.24 and the power wind profi le were used. Here we present the results
using the numerical inversion called Fixed-Talbot algorithm (Buske et al., 2009).
Giving a closer look to the results appearing in Table 7.5, we promptly note the good
agreement between the results attained with the ones of experimental data.
7.5.4 CASE STUDY: SIMULATION OF RADIOACTIVE POLLUTANT
USING LARGE EDDY SIMULATIONS (LES)
For a case study, we report numerical results for the time-dependent, approximated
3D advection–diffusion equation for Fickian fl ows (Equation 7.20). Vertical eddy diffusivity (Equation 7.23) and the lateral dispersion parameter (Equation 7.21) are used
TABLE 7.5
Results of Statistical Indices Used to Evaluate the
Model Performance of the Approximated
Three-Dimensional GILTT Solution (Equation
7.20) Using the IIT Delhi Experiment, Eddy
Diffusivity Equation 7.24, and Power Wind
Profi le
Model
NMSE
COR
FA2
FB
FS
Case 1
0.32
0.71
0.81
0.08
−0.11
Case 2
0.27
0.71
0.81
−0.07
−0.08
Case 3
0.33
0.71
0.94
−0.02
−0.21
Case 4
0.27
0.71
0.94
−0.01
−0.18
© 2010 by Taylor and Francis Group, LLC