

Parameterization of Convective Boundary Layer Turbulence and Clouds
101
poorly represented in atmospheric models (Ayotte et al. 1996). In order to organize
the study of the top-entrainment process, one may defi ne a rate of top-entrainment as
the difference between the time rate of BL height growth and the subsidence velocity
at the inversion, w i , expressed by the top-entrainment velocity, w ent :
ent
d
.
d
i
i
z
w
w
t
=
−
(4.63)
The fi rst conceptual model to compute the top-entrainment rate of the CBL was
suggested by Lilly (1968). This model is known as zeroth-order jump model and
represents the rate at which the mixed layer air penetrates into the upper stable
layer (see Figure 4.16a). For this, consider the inversion thickness δz null, z i is the
inversion height (where θ
′ ′
(
) i
v z
w
is minimum), the lapse rate γ = ∂ φ
–
v /∂z, and the inversion intensity is given by virtual potential temperature discontinuity at the inversion,
Δ φ
–
vi , leading to
d
(
) .
d
i
i
i
v i
e n t
v i
v z
z w
w
w
t
⎛
⎞
−
Δθ =
Δθ = − θ
′ ′
⎜
⎟
⎝
⎠
(4.64)
One of the better known approximations for the dry CBL considers the turbulent fl ux
of virtual potential temperature at the top of the BL,
θ
′ ′
(
) i
v z
w
, as a fi xed fraction, A wθ ,
of the surface fl ux, θ
′ ′
(
)
v s
w
(Betts 1973; Carson 1973; Tennekes 1973), that is,
min
(
)
(
)
(
) .
i
v z
v
w
v s
w
w
A w
θ
θ
=
θ
=
θ
′ ′
′ ′
′ ′
(4.65)
1.0
0.8
0.6
0.4
0.2
0.0
0.0
0.5
1.0
1.5
2.0
1%
3%
5%
ar
br
w u /w *
z/z
i
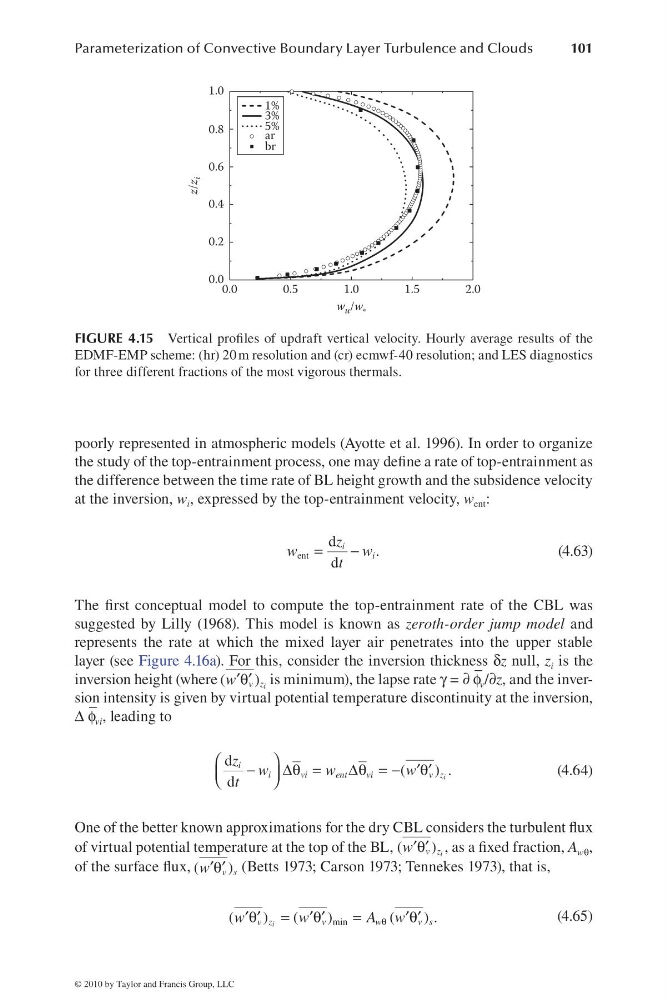
FIGURE 4.15 Vertical profi les of updraft vertical velocity. Hourly average results of the
EDMF-EMP scheme: (hr) 20 m resolution and (cr) ecmwf-40 resolution; and LES diagnostics
for three different fractions of the most vigorous thermals.
© 2010 by Taylor and Francis Group, LLC
101
poorly represented in atmospheric models (Ayotte et al. 1996). In order to organize
the study of the top-entrainment process, one may defi ne a rate of top-entrainment as
the difference between the time rate of BL height growth and the subsidence velocity
at the inversion, w i , expressed by the top-entrainment velocity, w ent :
ent
d
.
d
i
i
z
w
w
t
=
−
(4.63)
The fi rst conceptual model to compute the top-entrainment rate of the CBL was
suggested by Lilly (1968). This model is known as zeroth-order jump model and
represents the rate at which the mixed layer air penetrates into the upper stable
layer (see Figure 4.16a). For this, consider the inversion thickness δz null, z i is the
inversion height (where θ
′ ′
(
) i
v z
w
is minimum), the lapse rate γ = ∂ φ
–
v /∂z, and the inversion intensity is given by virtual potential temperature discontinuity at the inversion,
Δ φ
–
vi , leading to
d
(
) .
d
i
i
i
v i
e n t
v i
v z
z w
w
w
t
⎛
⎞
−
Δθ =
Δθ = − θ
′ ′
⎜
⎟
⎝
⎠
(4.64)
One of the better known approximations for the dry CBL considers the turbulent fl ux
of virtual potential temperature at the top of the BL,
θ
′ ′
(
) i
v z
w
, as a fi xed fraction, A wθ ,
of the surface fl ux, θ
′ ′
(
)
v s
w
(Betts 1973; Carson 1973; Tennekes 1973), that is,
min
(
)
(
)
(
) .
i
v z
v
w
v s
w
w
A w
θ
θ
=
θ
=
θ
′ ′
′ ′
′ ′
(4.65)
1.0
0.8
0.6
0.4
0.2
0.0
0.0
0.5
1.0
1.5
2.0
1%
3%
5%
ar
br
w u /w *
z/z
i
FIGURE 4.15 Vertical profi les of updraft vertical velocity. Hourly average results of the
EDMF-EMP scheme: (hr) 20 m resolution and (cr) ecmwf-40 resolution; and LES diagnostics
for three different fractions of the most vigorous thermals.
© 2010 by Taylor and Francis Group, LLC