

148
‘
INVESTIGATIONS IN FORTH,'1891.
pelagic at shes have increased in the protected area and its
vicinity. It is unsafe, however, to theorise under the circum—
-
stances.
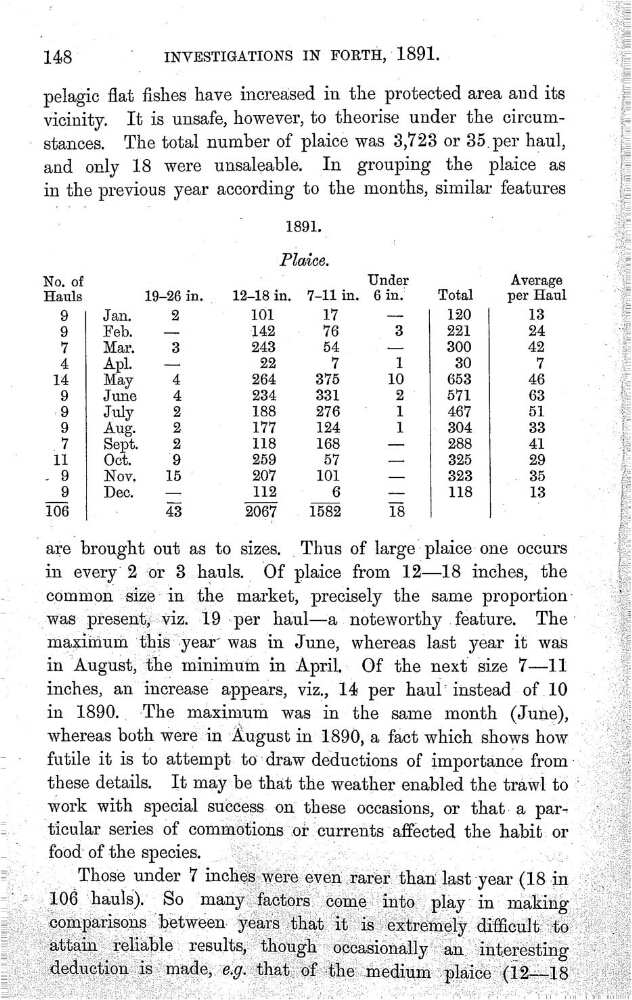
The total number of plaicè was 3,723 or 35,per haul,
‘
and only 18 were unsaleable.
In
grouping the plaice as
in the previous year according to the months, similar features
'
1891.
’
Plaice.
No. of
'
'
Under
’
Average
'
Hauls
19—26 in.
_
12—18 in.
7—11 in.
6 in.’
Total
per Haul
_
9
Jan.
2
101
17
—
120
13
_
_
9
Feb.
—
»
76
3
221
24
7
Mar.
3
243
54
_
300
42
—_
4
Apl.
_—
22
7
1
30
7
14
May
4
264
375
10
653
46
'
9
June
4
234
331
2 '
571
63
July
2
188
276
'
1
467
51
9
Aug.
2
177
124
1
-
304
33
_
7
Sept.
2
118
168
——
288
41
'
11
Oct.
9
259
57
—
325
29
;Îj
-
9
Nov,
15 -
207
101
_
323
.
35
_9
Dec.
:
112
_6
:
118
13
'
106
-
43
2067
1582
18
[
ont as to sizes. _Thus of
occurs
in every’
2 for 3
Of plaice from 12—18 inches, the
common size
in the market, pre0isely the same proportion
‘
19 -»per haul—a n0teworthy feature. The‘
maximum ‘this'ÿear' was in J une, whereas last year it was
‘ _
in August, the minimum in April. Of the next Size 7—11
inches, an increase appears, viz_., 14 per haul* instead of 10
.
in
The maximum was in the same month (June),
whereas both Were in
in 1890, a fact which shows how
'
futile it 18 130 attempt to“draw déductions of importance fromŸ
these
details.
I_t maybe that the weather enabled the traw-l to ‘
work
with special success
on‘ these Occasions, or that a par—.
ticular series of com10‘tions for feu-rrents affected the habit. or '
f00d' of the species.
;
106 Ïh3+ulS)-g
SO maYfætorsœmem’üopïw in ' màkisï
attamrel@bïe "resultssith0ughoecasmnayan Interestng
‘
INVESTIGATIONS IN FORTH,'1891.
pelagic at shes have increased in the protected area and its
vicinity. It is unsafe, however, to theorise under the circum—
-
stances.
The total number of plaicè was 3,723 or 35,per haul,
‘
and only 18 were unsaleable.
In
grouping the plaice as
in the previous year according to the months, similar features
'
1891.
’
Plaice.
No. of
'
'
Under
’
Average
'
Hauls
19—26 in.
_
12—18 in.
7—11 in.
6 in.’
Total
per Haul
_
9
Jan.
2
101
17
—
120
13
_
_
9
Feb.
—
»
76
3
221
24
7
Mar.
3
243
54
_
300
42
—_
4
Apl.
_—
22
7
1
30
7
14
May
4
264
375
10
653
46
'
9
June
4
234
331
2 '
571
63
July
2
188
276
'
1
467
51
9
Aug.
2
177
124
1
-
304
33
_
7
Sept.
2
118
168
——
288
41
'
11
Oct.
9
259
57
—
325
29
;Îj
-
9
Nov,
15 -
207
101
_
323
.
35
_9
Dec.
:
112
_6
:
118
13
'
106
-
43
2067
1582
18
[
ont as to sizes. _Thus of
occurs
in every’
2 for 3
Of plaice from 12—18 inches, the
common size
in the market, pre0isely the same proportion
‘
19 -»per haul—a n0teworthy feature. The‘
maximum ‘this'ÿear' was in J une, whereas last year it was
‘ _
in August, the minimum in April. Of the next Size 7—11
inches, an increase appears, viz_., 14 per haul* instead of 10
.
in
The maximum was in the same month (June),
whereas both Were in
in 1890, a fact which shows how
'
futile it 18 130 attempt to“draw déductions of importance fromŸ
these
details.
I_t maybe that the weather enabled the traw-l to ‘
work
with special success
on‘ these Occasions, or that a par—.
ticular series of com10‘tions for feu-rrents affected the habit. or '
f00d' of the species.
;
106 Ïh3+ulS)-g
SO maYfætorsœmem’üopïw in ' màkisï
attamrel@bïe "resultssith0ughoecasmnayan Interestng