

’
INVESTIGATIONS IN FORTE, 1890.
143
'
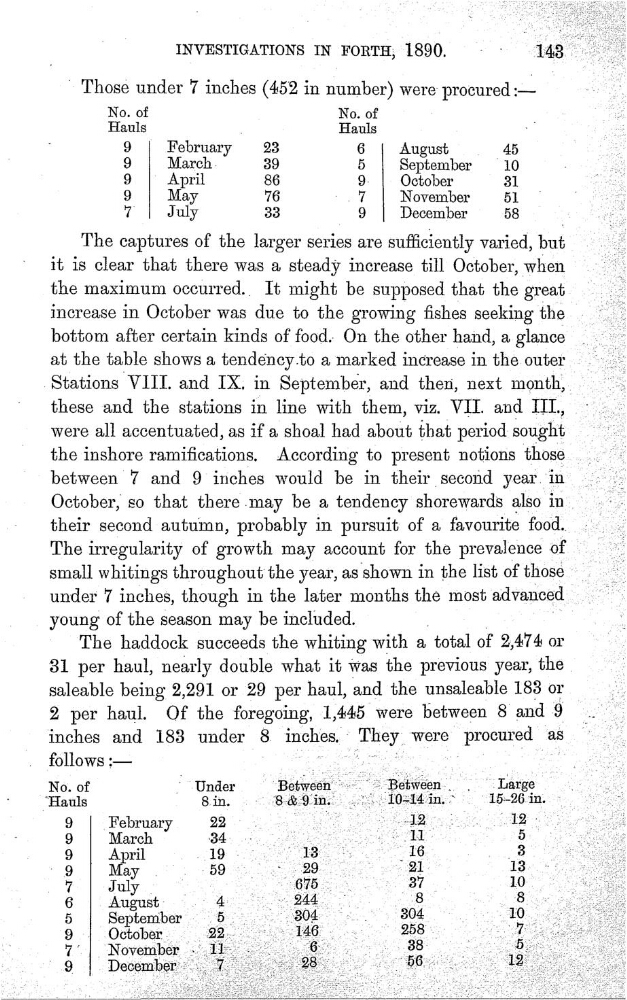
Those under 7 inches (4152 in number) were
No. of
No. of
.
Hauls
Hauls
‘
,
‘
9
February
23
6
August
_
45
‘
'
9
March
39
5
September
.
9
April
86
October
31
9
May
76
.
7
November
51
7
July
33
9
December
58
]
The captures of the larger series are sufciently varied, but
“
it is clear that there was a steadÿ increase till October, when
the maximum occurred, It might be supposed that the great
increase in October was due to the growing shes seeking the ,.
bottom after certain kinds of food. On the other hand, a glance
at the table
shows a tende‘ncyto a marked increase in the outer
Stations VIII. and IX. in September, and then, next month,
’
these and the stations in line with them, viz. VII. and III., ,
were all accentuated, as if a shoal had about that period sought
;
the inshore ramications. According to present notions those
7 and 9 inches would be in theirsecond y.ear_‘in
October, so that there.may be a tendency shorewards also
in
.
their second autumn, probably in pursuit of a favourite
The irregularity of growth may account for the prevalence
of
small whitings throughout the year, as
in the list of these
.
under 7 inches, though in the later months the most advanced _Ï,’
?
,
young of the Season may be included.
.
_
The haddock succeedsthe whiting with a total of 2,4:745 or
81 per haul, nearly double what it was
the previous year,
the
1
saleable being 2,291 or 29 per haul, and the unsaleable 183 or
2 per haul.
Of the foregoing, 1,4a455 were between
8 and
9
inches and 183 under
8
were procured
.
f0110WS =—
'
qd,ï
No. of
ŸUnder
Between Between
{Large
:
'
'_"'Hauls
Sin.
,
8&91n10—14m
9
February
22 ‘
_
,
12 %
,…
9
April
.
-19 '—_
:
13
__16
.
3
'
9
May .
-
“59
29
'
"
*21
'
,
13x
,
7
July
_
,
_“
675
‘
‘
';37
,
10Ï
.
'
6
-
August
:
4:
»
244
.
-
.
'
‘
518.
5
September
35
304 ‘
304.
‘
'
1°.
9
.
October —,
.
,
l’Ï1..Ÿ4ï‘ÏJÎL _— =
_
258Ÿ3’ ]
*‘Î7Î.
'
'
,
116
3.8
,
;
;
5
_,
_' 9
Decembef728
5612
INVESTIGATIONS IN FORTE, 1890.
143
'
Those under 7 inches (4152 in number) were
No. of
No. of
.
Hauls
Hauls
‘
,
‘
9
February
23
6
August
_
45
‘
'
9
March
39
5
September
.
9
April
86
October
31
9
May
76
.
7
November
51
7
July
33
9
December
58
]
The captures of the larger series are sufciently varied, but
“
it is clear that there was a steadÿ increase till October, when
the maximum occurred, It might be supposed that the great
increase in October was due to the growing shes seeking the ,.
bottom after certain kinds of food. On the other hand, a glance
at the table
shows a tende‘ncyto a marked increase in the outer
Stations VIII. and IX. in September, and then, next month,
’
these and the stations in line with them, viz. VII. and III., ,
were all accentuated, as if a shoal had about that period sought
;
the inshore ramications. According to present notions those
7 and 9 inches would be in theirsecond y.ear_‘in
October, so that there.may be a tendency shorewards also
in
.
their second autumn, probably in pursuit of a favourite
The irregularity of growth may account for the prevalence
of
small whitings throughout the year, as
in the list of these
.
under 7 inches, though in the later months the most advanced _Ï,’
?
,
young of the Season may be included.
.
_
The haddock succeedsthe whiting with a total of 2,4:745 or
81 per haul, nearly double what it was
the previous year,
the
1
saleable being 2,291 or 29 per haul, and the unsaleable 183 or
2 per haul.
Of the foregoing, 1,4a455 were between
8 and
9
inches and 183 under
8
were procured
.
f0110WS =—
'
qd,ï
No. of
ŸUnder
Between Between
{Large
:
'
'_"'Hauls
Sin.
,
8&91n10—14m
9
February
22 ‘
_
,
12 %
,…
9
April
.
-19 '—_
:
13
__16
.
3
'
9
May .
-
“59
29
'
"
*21
'
,
13x
,
7
July
_
,
_“
675
‘
‘
';37
,
10Ï
.
'
6
-
August
:
4:
»
244
.
-
.
'
‘
518.
5
September
35
304 ‘
304.
‘
'
1°.
9
.
October —,
.
,
l’Ï1..Ÿ4ï‘ÏJÎL _— =
_
258Ÿ3’ ]
*‘Î7Î.
'
'
,
116
3.8
,
;
;
5
_,
_' 9
Decembef728
5612