

Mercury Mines in Europe
10- 10
110 - 20
120 30
30 - 40
40 - 00
00-60
. 50 - 70
. >10
f
65
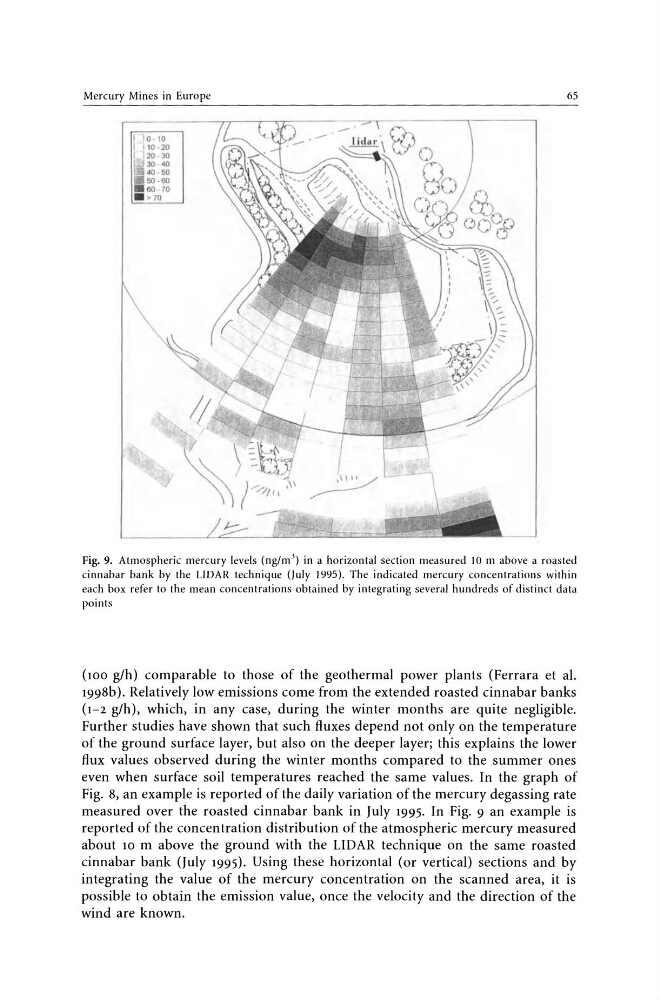
Fig_ 9_ Atmospheric mercury levels (ng/mJ) in a horizontal section measured 10m above a roasted
cinnabar bank by the L1DAR technique (July 1995). The indicated mercury concentrations within
each box refer to the mean concentrations obtained by integrating several hundreds of distinct data
points
(100 g/h) comparable to those of the geothermal power plants (Ferrara et al.
1998b). Relatively low emissions come from the extended roasted cinnabar banks
(1-2 g/h), which, in any case, during the winter months are quite negligible.
Further studies have shown that such fluxes depend not only on the temperature
of the ground surface layer, but also on the deeper layer; this explains the lower
flux values observed during the winter months compared to the summer ones
even when surface soil temperatures reached the same values. In the graph of
Fig. 8, an example is reported of the daily variation of the mercury degassing rate
measured over the roasted cinnabar bank in July 1995. In Fig. 9 an example is
reported of the concentration distribution of the atmospheric mercury measured
about 10 m above the ground with the LIDAR technique on the same roasted
cinnabar bank (July 1995). Using these horizontal (or vertical) sections and by
integrating the value of the mercury concentration on the scanned area, it is
possible to obtain the emission value, once the velocity and the direction of the
wind are known.
10- 10
110 - 20
120 30
30 - 40
40 - 00
00-60
. 50 - 70
. >10
f
65
Fig_ 9_ Atmospheric mercury levels (ng/mJ) in a horizontal section measured 10m above a roasted
cinnabar bank by the L1DAR technique (July 1995). The indicated mercury concentrations within
each box refer to the mean concentrations obtained by integrating several hundreds of distinct data
points
(100 g/h) comparable to those of the geothermal power plants (Ferrara et al.
1998b). Relatively low emissions come from the extended roasted cinnabar banks
(1-2 g/h), which, in any case, during the winter months are quite negligible.
Further studies have shown that such fluxes depend not only on the temperature
of the ground surface layer, but also on the deeper layer; this explains the lower
flux values observed during the winter months compared to the summer ones
even when surface soil temperatures reached the same values. In the graph of
Fig. 8, an example is reported of the daily variation of the mercury degassing rate
measured over the roasted cinnabar bank in July 1995. In Fig. 9 an example is
reported of the concentration distribution of the atmospheric mercury measured
about 10 m above the ground with the LIDAR technique on the same roasted
cinnabar bank (July 1995). Using these horizontal (or vertical) sections and by
integrating the value of the mercury concentration on the scanned area, it is
possible to obtain the emission value, once the velocity and the direction of the
wind are known.