

526
G.G. Pandit et al.
4.3 ~lg/l) towards the north where industries are situated. During the premonsoon,
the spatial profile of mercury showed a prominent peak (4.3 ~lg/l) at Airoli,
followed by a small peak (1 !lg/l) near Ghansoli and another at Sanpada (2 ~lg/l).
The spatial profile indicated considerable reduction in concentrations during the
postmonsoon period. The prominent peaks at the Airoli and Sanpada regions
decreased considerably but maintained higher concentrations (1.3 ~lg/l) in the
Ghansoli-Koparkhairane region. The spatial profile of total mercury in creek
water during the third cruise (May 1995) indicates generally very low concentration (0.03-0.3 ~lg/l) due to the control measures adopted by the industries
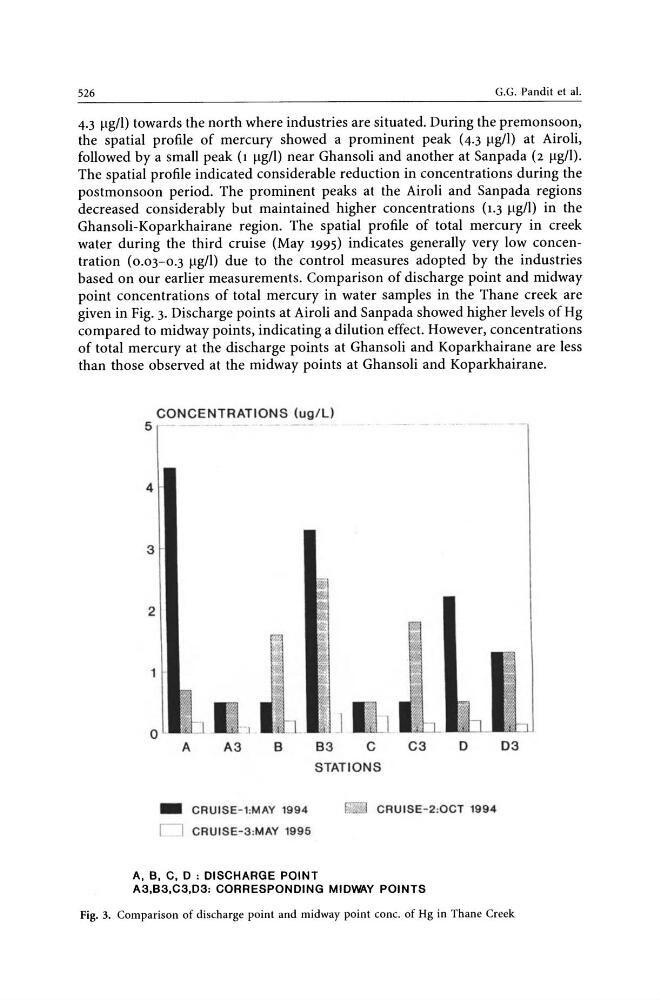
based on our earlier measurements. Comparison of discharge point and midway
point concentrations of total mercury in water samples in the Thane creek are
given in Fig. 3. Discharge points at Airoli and Sanpada showed higher levels of Hg
compared to midway points, indicating a dilution effect. However, concentrations
of total mercury at the discharge points at Ghansoli and Koparkhairane are less
than those observed at the midway points at Ghansoli and Koparkhairane.
CONCENTRATIONS (ug/L)
5
-- _._- -- .
4
3
2
o
1 - - . 1
J
A
A3
8
83
c
C3
o
STATIONS
_
CRUISE- 1:MAY 1994
I I CRUISE-3:MAY 1996
I~~\~ CRUISE - 2:0CT 1994
A. B. C. D : DISCHARGE POINT
A3.B3.C3.D3: CORRESPONDING MIDWAY POINTS
03
Fig. 3. Comparison of discharge point and midway point conc. of Hg in Thane Creek
G.G. Pandit et al.
4.3 ~lg/l) towards the north where industries are situated. During the premonsoon,
the spatial profile of mercury showed a prominent peak (4.3 ~lg/l) at Airoli,
followed by a small peak (1 !lg/l) near Ghansoli and another at Sanpada (2 ~lg/l).
The spatial profile indicated considerable reduction in concentrations during the
postmonsoon period. The prominent peaks at the Airoli and Sanpada regions
decreased considerably but maintained higher concentrations (1.3 ~lg/l) in the
Ghansoli-Koparkhairane region. The spatial profile of total mercury in creek
water during the third cruise (May 1995) indicates generally very low concentration (0.03-0.3 ~lg/l) due to the control measures adopted by the industries
based on our earlier measurements. Comparison of discharge point and midway
point concentrations of total mercury in water samples in the Thane creek are
given in Fig. 3. Discharge points at Airoli and Sanpada showed higher levels of Hg
compared to midway points, indicating a dilution effect. However, concentrations
of total mercury at the discharge points at Ghansoli and Koparkhairane are less
than those observed at the midway points at Ghansoli and Koparkhairane.
CONCENTRATIONS (ug/L)
5
-- _._- -- .
4
3
2
o
1 - - . 1
J
A
A3
8
83
c
C3
o
STATIONS
_
CRUISE- 1:MAY 1994
I I CRUISE-3:MAY 1996
I~~\~ CRUISE - 2:0CT 1994
A. B. C. D : DISCHARGE POINT
A3.B3.C3.D3: CORRESPONDING MIDWAY POINTS
03
Fig. 3. Comparison of discharge point and midway point conc. of Hg in Thane Creek