

Fluvial Transports of Mercury Pollution in the III River Basin (Northeastern France)
,---------------------------;'
-
~
CI)
CI)
E70 ~---------" - - - - - -
60
50 -
40
30
20 "
100
2
' "
~
--A- Low water of October 1994
-o-lligh water of May 1995
_ _ High Water of February 1996
_ _ Low water of July 1996
.,-- --,-----r
N
~
"~
§
§
.::: Vl
~
~
,~
'3
,(
.:::
9
' "
Vl
,!:l
"
';;j
;;:;>
Ji
,~
t
..0
0
'- 0
::§
'"
....l
E
S
,~
"
'0
Vl
1i
~
' "
1
S
t:l
' "
0
::r:
Stations
507
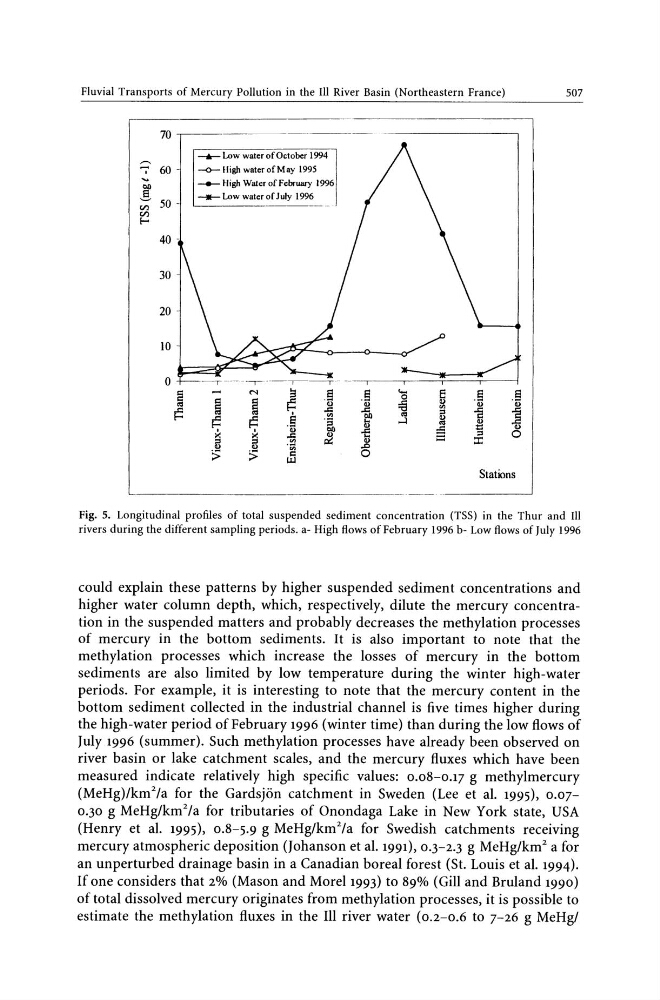
Fig. 5. Longitudinal profiles of total suspended sediment concentration (TSS) in the Thur and III
rivers during the different sampling periods. a- High flows of February 1996 b- Low flows of July 1996
could explain these patterns by higher suspended sediment concentrations and
higher water column depth, which, respectively, dilute the mercury concentration in the suspended matters and probably decreases the methylation processes
of mercury in the bottom sediments. It is also important to note that the
methylation processes which increase the losses of mercury in the bottom
sediments are also limited by low temperature during the winter high-water
periods. For example, it is interesting to note that the mercury content in the
bottom sediment collected in the industrial channel is five times higher during
the high-water period of February 1996 (winter time) than during the low flows of
July 1996 (summer). Such methylation processes have already been observed on
river basin or lake catchment scales, and the mercury fluxes which have been
measured indicate relatively high specific values: 0.08-0.17 g methylmercury
(MeHg)/km2/a for the Gardsjon catchment in Sweden (Lee et a1. 1995), 0.070.30 g MeHg/km2/a for tributaries of Onondaga Lake in New York state, USA
(Henry et a1. 1995), 0.8-5.9 g MeHg/km2/a for Swedish catchments receiving
mercury atmospheric deposition (Johanson et a1. 1991), 0.3-2.3 g MeHg/km2 a for
an unperturbed drainage basin in a Canadian boreal forest (St. Louis et a1. 1994).
If one considers that 2% (Mason and Morel 1993) to 89% (Gill and Bruland 1990)
of total dissolved mercury originates from methylation processes, it is possible to
estimate the methylation fluxes in the III river water (0.2-0.6 to 7-26 g MeHg/
,---------------------------;'
-
~
CI)
CI)
E70 ~---------" - - - - - -
60
50 -
40
30
20 "
100
2
' "
~
--A- Low water of October 1994
-o-lligh water of May 1995
_ _ High Water of February 1996
_ _ Low water of July 1996
.,-- --,-----r
N
~
"~
§
§
.::: Vl
~
~
,~
'3
,(
.:::
9
' "
Vl
,!:l
"
';;j
;;:;>
Ji
,~
t
..0
0
'- 0
::§
'"
....l
E
S
,~
"
'0
Vl
1i
~
' "
1
S
t:l
' "
0
::r:
Stations
507
Fig. 5. Longitudinal profiles of total suspended sediment concentration (TSS) in the Thur and III
rivers during the different sampling periods. a- High flows of February 1996 b- Low flows of July 1996
could explain these patterns by higher suspended sediment concentrations and
higher water column depth, which, respectively, dilute the mercury concentration in the suspended matters and probably decreases the methylation processes
of mercury in the bottom sediments. It is also important to note that the
methylation processes which increase the losses of mercury in the bottom
sediments are also limited by low temperature during the winter high-water
periods. For example, it is interesting to note that the mercury content in the
bottom sediment collected in the industrial channel is five times higher during
the high-water period of February 1996 (winter time) than during the low flows of
July 1996 (summer). Such methylation processes have already been observed on
river basin or lake catchment scales, and the mercury fluxes which have been
measured indicate relatively high specific values: 0.08-0.17 g methylmercury
(MeHg)/km2/a for the Gardsjon catchment in Sweden (Lee et a1. 1995), 0.070.30 g MeHg/km2/a for tributaries of Onondaga Lake in New York state, USA
(Henry et a1. 1995), 0.8-5.9 g MeHg/km2/a for Swedish catchments receiving
mercury atmospheric deposition (Johanson et a1. 1991), 0.3-2.3 g MeHg/km2 a for
an unperturbed drainage basin in a Canadian boreal forest (St. Louis et a1. 1994).
If one considers that 2% (Mason and Morel 1993) to 89% (Gill and Bruland 1990)
of total dissolved mercury originates from methylation processes, it is possible to
estimate the methylation fluxes in the III river water (0.2-0.6 to 7-26 g MeHg/