

Fluvial Transports of Mercury Pollution in the III River Basin (Northeastern France)
505
I ......... High . . tero~~ 1996.-~:-LowwaterorJuly 19961
24 -_ .. _--.......- Lowwat«ofOctob.l994
80
7 ..
--0- High waler of May 1995
,.
---.!20
--+-High waferofFebruary 1996
~64
\~
~16
~Lo~~terofJuJy 1996
~l48
ConOuenc::e
12
~
32
16
0
0
E
i
~
.§
.U
I
~
I
.§
J
f t
~
.~
Ii
~
G
1
·Ii
E .Ii :I
f J J
§
1 t
! J
j
J
Ii
J J
~
' " ~
:z:
;;:
Statio ..
Stalions
a30
_._-_. ~~--. ---.......- Low _ler ofOdobcr 1994
7~
-o-HighwatcrofMay 1995
" 25
-+-HighwatcrofFcbrulU)' 19S15
.!
.......... I.owwatorofJuly 1996
g20
15
Lauch
\0
0 ;
N
~
I f I J I
J
F
~ ~
j
~
~
C!
~
0
Stations
_ . _ - - - - - -
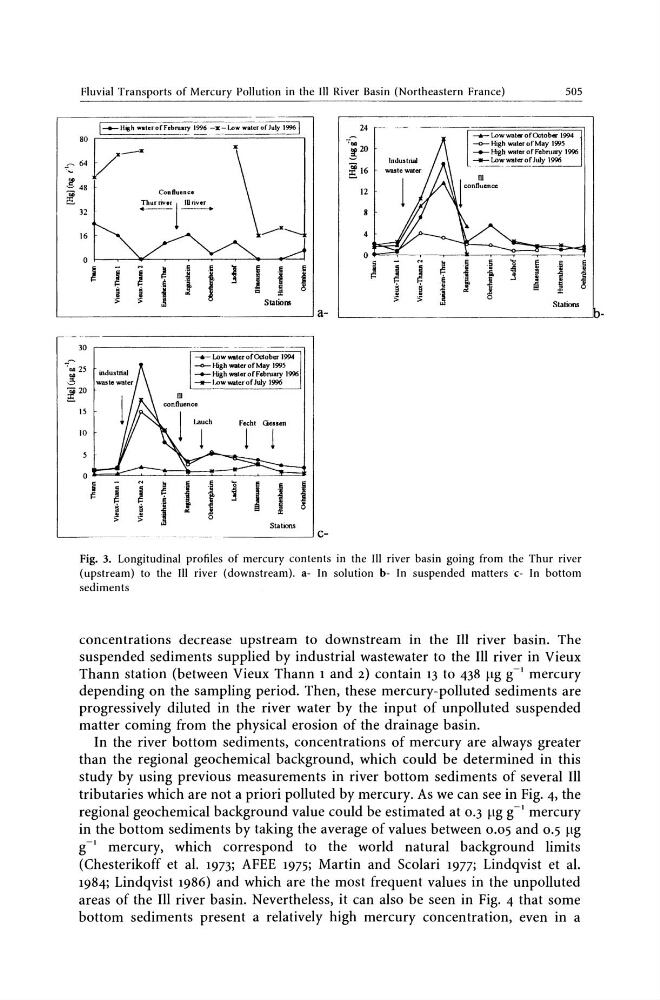
cFig. 3. Longitudinal profiles of mercury contents in the III river basin going from the Thur river
(upstream) to the III river (downstream). a- In solution b- In suspended matters 'c- In bottom
sediments
concentrations decrease upstream to downstream in the III river basin. The
suspended sediments supplied by industrial wastewater to the III river in Vieux
Thann station (between Vieux Thann 1 and 2) contain 13 to 438 ~lg g - I mercury
depending on the sampling period. Then, these mercury-polluted sediments are
progressively diluted in the river water by the input of unpolluted suspended
matter coming from the physical erosion of the drainage basin.
In the river bottom sediments, concentrations of mercury are always greater
than the regional geochemical background, which could be determined in this
study by using previous measurements in river bottom sediments of several III
tributaries which are not a priori polluted by mercury. As we can see in Fig. 4, the
regional geochemical background value could be estimated at 0.3 ~Lg g - I mercury
in the bottom sediments by taking the average of values between 0.05 and 0.5 ~lg
g - I mercury, which correspond to the world natural background limits
(Chesterikoff et al. 1973; AFEE 1975; Martin and Scolari 1977; Lindqvist et al.
1984; Lindqvist 1986) and which are the most frequent values in the unpolluted
areas of the III river basin. Nevertheless, it can also be seen in Fig. 4 that some
bottom sediments present a relatively high mercury concentration, even in a
505
I ......... High . . tero~~ 1996.-~:-LowwaterorJuly 19961
24 -_ .. _--.......- Lowwat«ofOctob.l994
80
7 ..
--0- High waler of May 1995
,.
---.!20
--+-High waferofFebruary 1996
~64
\~
~16
~Lo~~terofJuJy 1996
~l48
ConOuenc::e
12
~
32
16
0
0
E
i
~
.§
.U
I
~
I
.§
J
f t
~
.~
Ii
~
G
1
·Ii
E .Ii :I
f J J
§
1 t
! J
j
J
Ii
J J
~
' " ~
:z:
;;:
Statio ..
Stalions
a30
_._-_. ~~--. ---.......- Low _ler ofOdobcr 1994
7~
-o-HighwatcrofMay 1995
" 25
-+-HighwatcrofFcbrulU)' 19S15
.!
.......... I.owwatorofJuly 1996
g20
15
Lauch
\0
0 ;
N
~
I f I J I
J
F
~ ~
j
~
~
C!
~
0
Stations
_ . _ - - - - - -
cFig. 3. Longitudinal profiles of mercury contents in the III river basin going from the Thur river
(upstream) to the III river (downstream). a- In solution b- In suspended matters 'c- In bottom
sediments
concentrations decrease upstream to downstream in the III river basin. The
suspended sediments supplied by industrial wastewater to the III river in Vieux
Thann station (between Vieux Thann 1 and 2) contain 13 to 438 ~lg g - I mercury
depending on the sampling period. Then, these mercury-polluted sediments are
progressively diluted in the river water by the input of unpolluted suspended
matter coming from the physical erosion of the drainage basin.
In the river bottom sediments, concentrations of mercury are always greater
than the regional geochemical background, which could be determined in this
study by using previous measurements in river bottom sediments of several III
tributaries which are not a priori polluted by mercury. As we can see in Fig. 4, the
regional geochemical background value could be estimated at 0.3 ~Lg g - I mercury
in the bottom sediments by taking the average of values between 0.05 and 0.5 ~lg
g - I mercury, which correspond to the world natural background limits
(Chesterikoff et al. 1973; AFEE 1975; Martin and Scolari 1977; Lindqvist et al.
1984; Lindqvist 1986) and which are the most frequent values in the unpolluted
areas of the III river basin. Nevertheless, it can also be seen in Fig. 4 that some
bottom sediments present a relatively high mercury concentration, even in a