

428
A. Matsuyama et al.
3.2
Differences in the Percentages of Mercuric Sulfide Removed by Heat
from Mercury-Contaminated Soil Made with Standard Sand,
Mercury-Contaminated Soil Made with Quartz Sand,
and Pure Mercuric Sulfide
The most notable results of the tests described above were the differences in the
percentages of mercury removed by heat between the quartz sands and pure
mercuric sulfide, and the differences in those of mercury-contaminated soils
made with standard sand and mercury-contaminated soils made with quartz
sand. First, we will discuss the differences in the percentages of mercury removed
over time by heat in the quartz sands and mercuric sulfide. As Table 1 showing
the X-ray fluorescent test results indicates, the quartz sand used in this test did
not contain metals other than silicon (Si). The heating test results show that the
mercury removal percentages of mercury-contaminated soil made with quartz
sand clearly improved over time compared to those of the mercuric sulfide.
According to the results of X-ray powder analyses conducted before and after
heating, no great differences in the peaks were observed, and no product was
generated when the quartz sand and mercuric sulfide were heated. The results
suggest that mercuric sulfide was not removed through evaporation caused by a
heat-induced reaction between the quartz sand and the mrcuric sulfide, but by
the physical and chemical characteristics of the quartz sand when it was mixed
with mercuric sulfide and heated.
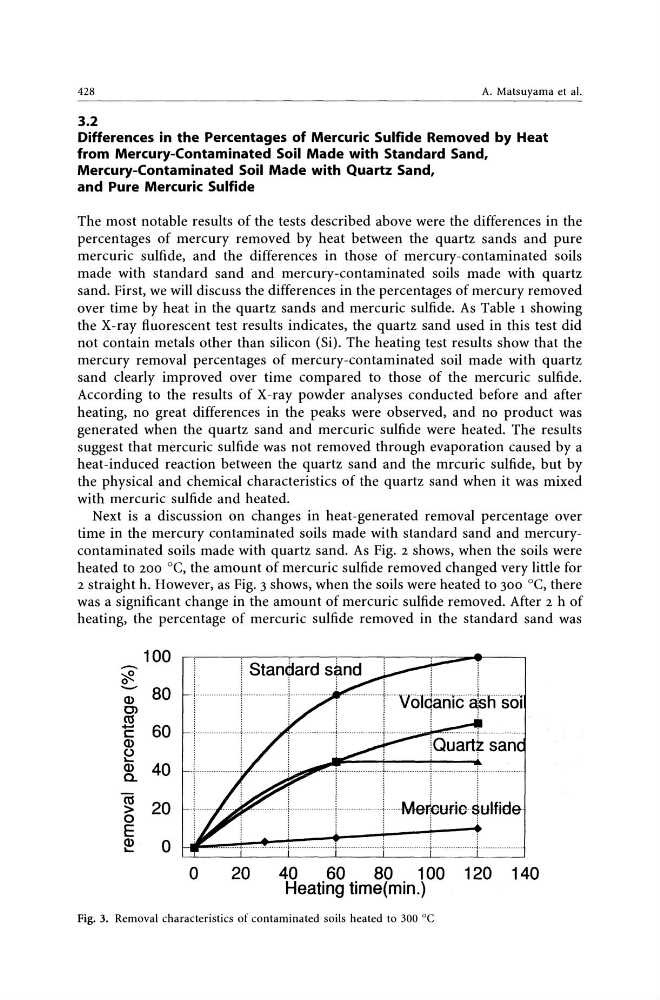
Next is a discussion on changes in heat-generated removal percentage over
time in the mercury contaminated soils made with standard sand and mercurycontaminated soils made with quartz sand. As Fig. 2 shows, when the soils were
heated to 200°C, the amount of mercuric sulfide removed changed very little for
2 straight h. However, as Fig. 3 shows, when the soils were heated to 300°C, there
was a significant change in the amount of mercuric sulfide removed. After 2 h of
heating, the percentage of mercuric sulfide removed in the standard sand was
100
80
60
40
20
o
! Standard s~nd
!
1
!
-1---·----········-+
' --r
i i i
, ..... .
:
-------r---··
. . . . L . . . . . Me~CUr1c .. ~ul.nde
o 20 40 60 80 100 120 140
Heating time(min.)
Fig. 3. Removal characteristics of contaminated soils heated to 300°C
A. Matsuyama et al.
3.2
Differences in the Percentages of Mercuric Sulfide Removed by Heat
from Mercury-Contaminated Soil Made with Standard Sand,
Mercury-Contaminated Soil Made with Quartz Sand,
and Pure Mercuric Sulfide
The most notable results of the tests described above were the differences in the
percentages of mercury removed by heat between the quartz sands and pure
mercuric sulfide, and the differences in those of mercury-contaminated soils
made with standard sand and mercury-contaminated soils made with quartz
sand. First, we will discuss the differences in the percentages of mercury removed
over time by heat in the quartz sands and mercuric sulfide. As Table 1 showing
the X-ray fluorescent test results indicates, the quartz sand used in this test did
not contain metals other than silicon (Si). The heating test results show that the
mercury removal percentages of mercury-contaminated soil made with quartz
sand clearly improved over time compared to those of the mercuric sulfide.
According to the results of X-ray powder analyses conducted before and after
heating, no great differences in the peaks were observed, and no product was
generated when the quartz sand and mercuric sulfide were heated. The results
suggest that mercuric sulfide was not removed through evaporation caused by a
heat-induced reaction between the quartz sand and the mrcuric sulfide, but by
the physical and chemical characteristics of the quartz sand when it was mixed
with mercuric sulfide and heated.
Next is a discussion on changes in heat-generated removal percentage over
time in the mercury contaminated soils made with standard sand and mercurycontaminated soils made with quartz sand. As Fig. 2 shows, when the soils were
heated to 200°C, the amount of mercuric sulfide removed changed very little for
2 straight h. However, as Fig. 3 shows, when the soils were heated to 300°C, there
was a significant change in the amount of mercuric sulfide removed. After 2 h of
heating, the percentage of mercuric sulfide removed in the standard sand was
100
80
60
40
20
o
! Standard s~nd
!
1
!
-1---·----········-+
' --r
i i i
, ..... .
:
-------r---··
. . . . L . . . . . Me~CUr1c .. ~ul.nde
o 20 40 60 80 100 120 140
Heating time(min.)
Fig. 3. Removal characteristics of contaminated soils heated to 300°C