

Mercury in Terrestrial Food Webs of the Idrija Mining Area
313
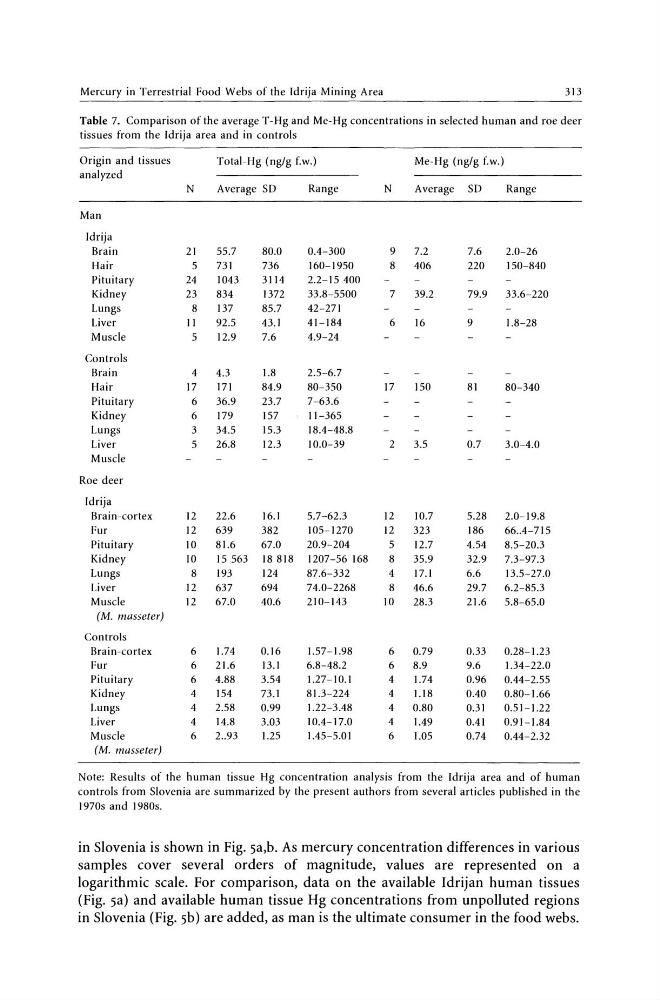
Table 7. Comparison of the average T-Hg and Me-Hg concentrations in selected human and roe deer
tissues from the Idrija area and in controls
Origin and tissues
analyzed
Man
Idrija
Brain
Hair
Pituitary
Kidney
Lungs
Liver
Muscle
Controls
Brain
Hair
Pituitary
Kidney
Lungs
Liver
Muscle
Roe deer
Idrija
Brain-cortex
Fur
Pituitary
Kidney
Lungs
Liver
Muscle
(M. masseter)
Controls
Brain-cortex
Fur
Pituitary
Kidney
Lungs
Liver
Muscle
(M. masseter)
Total-Hg (ng/g f.w.)
Me-Hg (nglg f.w.)
N
Average SD
Range
N
Average SD
Range
21
55.7
5
731
24
1043
23
834
8
137
II
92.5
5
12.9
4
4.3
17
171
6
36.9
6
179
3
34.5
5
26.8
80.0
736
3114
1372
85.7
43.1
7.6
1.8
84.9
23.7
157
15.3
12.3
0.4-300
160-1950
2.2-15400
33.8-5500
42-271
41-184
4.9-24
2.5-6.7
80-350
7-63.6
11-365
18.4-48.8
10.0-39
9
7.2
8
406
7
39.2
6
16
17
150
2
3.5
12
22.6
16.1
5.7-62.3
12
10.7
12
639
382
105-1270
12
323
10
81.6
67.0
20.9-204
5
12.7
10
15563 18818 1207-56168
8
35.9
8
193
124
87.6-332
4
17.1
12
637
694
74.0-2268
8
46.6
12
67.0
40.6
210-143
10
28.3
6
1.74
6
21.6
6
4.88
4
154
4
2.58
4
14.8
6
2 .. 93
0.16
13.1
3.54
73.1
0.99
3.03
1.25
1.57-1.98
6.8-48.2
1.27-10.1
81.3-224
1.22-3.48
10.4-17.0
1.45-5.01
6
0.79
6
8.9
4
1.74
4
1.18
4
0.80
4
1.49
6
1.05
7.6
2.0-26
220
150-840
79.9
33.6-220
9
1.8-28
81
80-340
0.7
3.0-4.0
5.28
2.0-19.8
186
66..4-715
4.54
8.5-20.3
32.9
7.3-97.3
6.6
13.5-27.0
29.7
6.2-85.3
21.6
5.8-65.0
0.33
0.28-1.23
9.6
1.34-22.0
0.96
0.44-2.55
0.40
0.80-1.66
0.31
0.51-1.22
0.41
0.91-1.84
0.74
0.44-2.32
Note: Results of the human tissue Hg concentration analysis from the Idrija area and of human
controls from Slovenia are summarized by the present authors from several articles published in the
1970s and 1980s.
in Slovenia is shown in Fig. 5a,b. As mercury concentration differences in various
samples cover several orders of magnitude, values are represented on a
logarithmic scale. For comparison, data on the available Idrijan human tissues
(Fig. 5a) and available human tissue Hg concentrations from unpolluted regions
in Slovenia (Fig. 5b) are added, as man is the ultimate consumer in the food webs.
313
Table 7. Comparison of the average T-Hg and Me-Hg concentrations in selected human and roe deer
tissues from the Idrija area and in controls
Origin and tissues
analyzed
Man
Idrija
Brain
Hair
Pituitary
Kidney
Lungs
Liver
Muscle
Controls
Brain
Hair
Pituitary
Kidney
Lungs
Liver
Muscle
Roe deer
Idrija
Brain-cortex
Fur
Pituitary
Kidney
Lungs
Liver
Muscle
(M. masseter)
Controls
Brain-cortex
Fur
Pituitary
Kidney
Lungs
Liver
Muscle
(M. masseter)
Total-Hg (ng/g f.w.)
Me-Hg (nglg f.w.)
N
Average SD
Range
N
Average SD
Range
21
55.7
5
731
24
1043
23
834
8
137
II
92.5
5
12.9
4
4.3
17
171
6
36.9
6
179
3
34.5
5
26.8
80.0
736
3114
1372
85.7
43.1
7.6
1.8
84.9
23.7
157
15.3
12.3
0.4-300
160-1950
2.2-15400
33.8-5500
42-271
41-184
4.9-24
2.5-6.7
80-350
7-63.6
11-365
18.4-48.8
10.0-39
9
7.2
8
406
7
39.2
6
16
17
150
2
3.5
12
22.6
16.1
5.7-62.3
12
10.7
12
639
382
105-1270
12
323
10
81.6
67.0
20.9-204
5
12.7
10
15563 18818 1207-56168
8
35.9
8
193
124
87.6-332
4
17.1
12
637
694
74.0-2268
8
46.6
12
67.0
40.6
210-143
10
28.3
6
1.74
6
21.6
6
4.88
4
154
4
2.58
4
14.8
6
2 .. 93
0.16
13.1
3.54
73.1
0.99
3.03
1.25
1.57-1.98
6.8-48.2
1.27-10.1
81.3-224
1.22-3.48
10.4-17.0
1.45-5.01
6
0.79
6
8.9
4
1.74
4
1.18
4
0.80
4
1.49
6
1.05
7.6
2.0-26
220
150-840
79.9
33.6-220
9
1.8-28
81
80-340
0.7
3.0-4.0
5.28
2.0-19.8
186
66..4-715
4.54
8.5-20.3
32.9
7.3-97.3
6.6
13.5-27.0
29.7
6.2-85.3
21.6
5.8-65.0
0.33
0.28-1.23
9.6
1.34-22.0
0.96
0.44-2.55
0.40
0.80-1.66
0.31
0.51-1.22
0.41
0.91-1.84
0.74
0.44-2.32
Note: Results of the human tissue Hg concentration analysis from the Idrija area and of human
controls from Slovenia are summarized by the present authors from several articles published in the
1970s and 1980s.
in Slovenia is shown in Fig. 5a,b. As mercury concentration differences in various
samples cover several orders of magnitude, values are represented on a
logarithmic scale. For comparison, data on the available Idrijan human tissues
(Fig. 5a) and available human tissue Hg concentrations from unpolluted regions
in Slovenia (Fig. 5b) are added, as man is the ultimate consumer in the food webs.