

14
R. Ebinghaus et al.
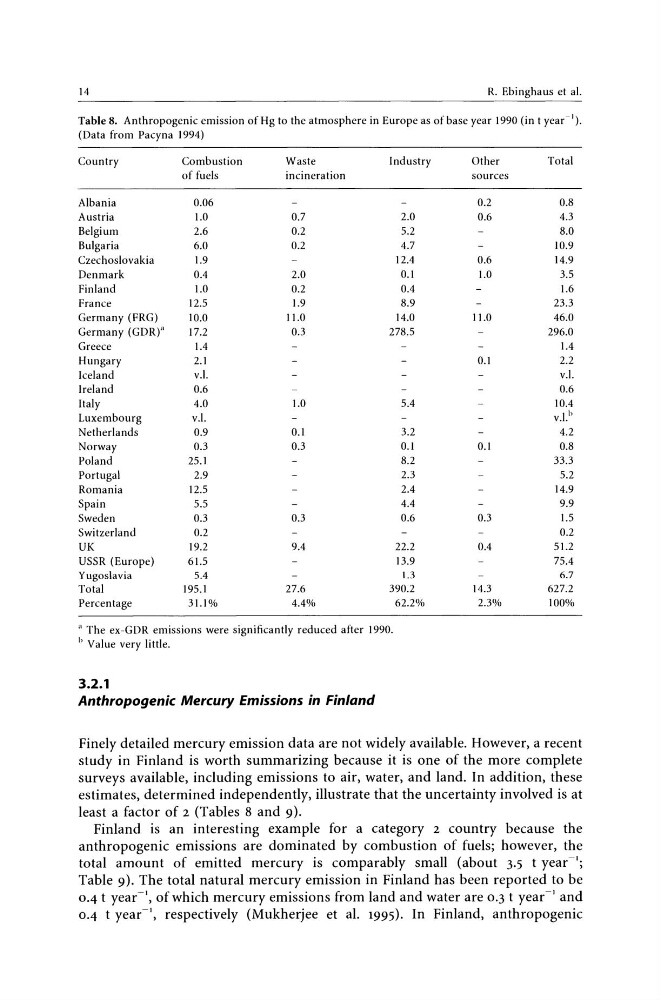
Table 8. Anthropogenic emission of Hg to the atmosphere in Europe as of base year 1990 (in t year -).
(Data from Pacyna 1994)
Country
Combustion
Waste
Industry
Other
Total
of fuels
incineration
sources
Albania
0.06
0.2
0.8
Austria
1.0
0.7
2.0
0.6
4.3
Belgium
2.6
0.2
5.2
8.0
Bulgaria
6.0
0.2
4.7
10.9
Czechoslovakia
1.9
12.4
0.6
14.9
Denmark
0.4
2.0
0.1
1.0
3.5
Finland
1.0
0.2
0.4
1.6
France
12.5
1.9
8.9
23.3
Germany (FRG)
10.0
11.0
14.0
11.0
46.0
Germany (GDR)"
17.2
0.3
278.5
296.0
Greece
1.4
1.4
Hungary
2.1
0.1
2.2
Iceland
v.1.
v.1.
Ireland
0.6
0.6
Italy
4.0
1.0
5.4
10.4
Luxembourg
v.1.
v.I."
Netherlands
0.9
0.1
3.2
4.2
Norway
0.3
0.3
0.1
0.1
0.8
Poland
25.1
8.2
33.3
Portugal
2.9
2.3
5.2
Romania
12.5
2.4
14.9
Spain
5.5
4.4
9.9
Sweden
0.3
0.3
0.6
0.3
1.5
Switzerland
0.2
0.2
UK
19.2
9.4
22.2
0.4
51.2
USSR (Europe)
61.5
13.9
75.4
Yugoslavia
5.4
1.3
6.7
Total
195.1
27.6
390.2
14.3
627.2
Percentage
31.1%
4.4%
62.2%
2.3%
100%
" The ex-GDR emissions were significantly reduced after 1990.
" Value very little.
3.2.1
Anthropogenic Mercury Emissions in Finland
Finely detailed mercury emission data are not widely available. However, a recent
study in Finland is worth summarizing because it is one of the more complete
surveys available, including emissions to air, water, and land. In addition, these
estimates, determined independently, illustrate that the uncertainty involved is at
least a factor of 2 (Tables 8 and 9).
Finland is an interesting example for a category 2 country because the
anthropogenic emissions are dominated by combustion of fuels; however, the
total amount of emitted mercury is comparably small (about 3.5 t year-I;
Table 9). The total natural mercury emission in Finland has been reported to be
0.4 t year -I, of which mercury emissions from land and water are 0.3 t year -I and
0.4 t year-I, respectively (Mukherjee et al. 1995). In Finland, anthropogenic
R. Ebinghaus et al.
Table 8. Anthropogenic emission of Hg to the atmosphere in Europe as of base year 1990 (in t year -).
(Data from Pacyna 1994)
Country
Combustion
Waste
Industry
Other
Total
of fuels
incineration
sources
Albania
0.06
0.2
0.8
Austria
1.0
0.7
2.0
0.6
4.3
Belgium
2.6
0.2
5.2
8.0
Bulgaria
6.0
0.2
4.7
10.9
Czechoslovakia
1.9
12.4
0.6
14.9
Denmark
0.4
2.0
0.1
1.0
3.5
Finland
1.0
0.2
0.4
1.6
France
12.5
1.9
8.9
23.3
Germany (FRG)
10.0
11.0
14.0
11.0
46.0
Germany (GDR)"
17.2
0.3
278.5
296.0
Greece
1.4
1.4
Hungary
2.1
0.1
2.2
Iceland
v.1.
v.1.
Ireland
0.6
0.6
Italy
4.0
1.0
5.4
10.4
Luxembourg
v.1.
v.I."
Netherlands
0.9
0.1
3.2
4.2
Norway
0.3
0.3
0.1
0.1
0.8
Poland
25.1
8.2
33.3
Portugal
2.9
2.3
5.2
Romania
12.5
2.4
14.9
Spain
5.5
4.4
9.9
Sweden
0.3
0.3
0.6
0.3
1.5
Switzerland
0.2
0.2
UK
19.2
9.4
22.2
0.4
51.2
USSR (Europe)
61.5
13.9
75.4
Yugoslavia
5.4
1.3
6.7
Total
195.1
27.6
390.2
14.3
627.2
Percentage
31.1%
4.4%
62.2%
2.3%
100%
" The ex-GDR emissions were significantly reduced after 1990.
" Value very little.
3.2.1
Anthropogenic Mercury Emissions in Finland
Finely detailed mercury emission data are not widely available. However, a recent
study in Finland is worth summarizing because it is one of the more complete
surveys available, including emissions to air, water, and land. In addition, these
estimates, determined independently, illustrate that the uncertainty involved is at
least a factor of 2 (Tables 8 and 9).
Finland is an interesting example for a category 2 country because the
anthropogenic emissions are dominated by combustion of fuels; however, the
total amount of emitted mercury is comparably small (about 3.5 t year-I;
Table 9). The total natural mercury emission in Finland has been reported to be
0.4 t year -I, of which mercury emissions from land and water are 0.3 t year -I and
0.4 t year-I, respectively (Mukherjee et al. 1995). In Finland, anthropogenic