

238
N.A. Ozerova et al.
m- 3 and more. Mercury was determined by turbocalorimeter with the help of the
Polezhaev reactive.
This method of mercury determination in oil uses the combustion of oil in the
air force with an oxidizer, granulated copper oxide, and with simultaneous
capture of mercury in the refrigerator. Metallic mercury was determined by the
turbocalorimeter in a kind of CuHgl3 salt difficult to dissolve (for details see
Ozerova et al. 1974; Saukov et al. 1972).
The chemical methods are fairly difficult.
The atomic-absorptional method using the Zeeman effect (atomic absorption
spectrometer RA-915) was prepared and used for this reason. A spectrometer RA915 has a background corrector itself: reduction of the initial resonance radiation
up to 5% does not cause false response. Hydrocarbon gases were analyzed by this
method later. However, the magnitude of background absorption could exceed
the acceptable level during the analysis of samples with the complex matrix (oil
and oil products). In order to reduce the magnitude of background absorption, a
two-section atomizer was used. The sample is evaporated and mercury
compounds are partially decomposed in the first step; then all mercury
compounds are fully decomposed and the hydrocarbon matrix is comb us ted in
the next step (Ganeev et al. 1995a).
Only atomic mercury is determined during the analysis of hydrocarbon gases.
Experiments with pyrolisis (temperature level 750-800 °C in the reactor) and
photolysis (temperature level approximately 50-60°C in the reactor) were made
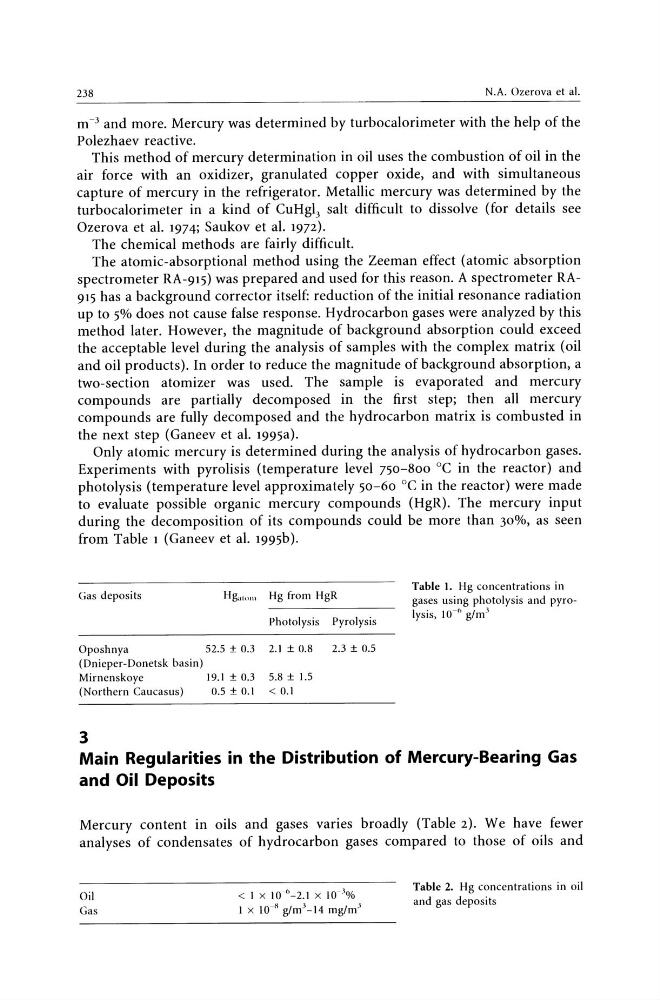
to evaluate possible organic mercury compounds (HgR). The mercury input
during the decomposition of its compounds could be more than 30%, as seen
from Table 1 (Ganeev et al. 1995b).
Gas deposits
Hga10m Hg from HgR
Photolysis Pyrolysis
Oposhnya
52.5 ± 0.3 2.1 ± 0.8
2.3 ± 0.5
(Dnieper-Donetsk basin)
Mirnenskoye
19.1 ± 0.3 5.8 ± 1.5
(Northern Caucasus)
0.5 ± 0.1 < 0.1
3
Table 1. Hg concentrations in
gases using photolysis and pyrolysis, 10- 0 ghn· l
Main Regularities in the Distribution of Mercury-Bearing Gas
and Oil Deposits
Mercury content in oils and gases varies broadly (Table 2). We have fewer
analyses of condensates of hydrocarbon gases compared to those of oils and
Oil
Gas
< I X 10- 6 -2.1 x 10-"'%
I x 10- 8 g/mJ_ 14 mg/m"'
Table 2. Hg concentrations in oil
and gas deposi Is
N.A. Ozerova et al.
m- 3 and more. Mercury was determined by turbocalorimeter with the help of the
Polezhaev reactive.
This method of mercury determination in oil uses the combustion of oil in the
air force with an oxidizer, granulated copper oxide, and with simultaneous
capture of mercury in the refrigerator. Metallic mercury was determined by the
turbocalorimeter in a kind of CuHgl3 salt difficult to dissolve (for details see
Ozerova et al. 1974; Saukov et al. 1972).
The chemical methods are fairly difficult.
The atomic-absorptional method using the Zeeman effect (atomic absorption
spectrometer RA-915) was prepared and used for this reason. A spectrometer RA915 has a background corrector itself: reduction of the initial resonance radiation
up to 5% does not cause false response. Hydrocarbon gases were analyzed by this
method later. However, the magnitude of background absorption could exceed
the acceptable level during the analysis of samples with the complex matrix (oil
and oil products). In order to reduce the magnitude of background absorption, a
two-section atomizer was used. The sample is evaporated and mercury
compounds are partially decomposed in the first step; then all mercury
compounds are fully decomposed and the hydrocarbon matrix is comb us ted in
the next step (Ganeev et al. 1995a).
Only atomic mercury is determined during the analysis of hydrocarbon gases.
Experiments with pyrolisis (temperature level 750-800 °C in the reactor) and
photolysis (temperature level approximately 50-60°C in the reactor) were made
to evaluate possible organic mercury compounds (HgR). The mercury input
during the decomposition of its compounds could be more than 30%, as seen
from Table 1 (Ganeev et al. 1995b).
Gas deposits
Hga10m Hg from HgR
Photolysis Pyrolysis
Oposhnya
52.5 ± 0.3 2.1 ± 0.8
2.3 ± 0.5
(Dnieper-Donetsk basin)
Mirnenskoye
19.1 ± 0.3 5.8 ± 1.5
(Northern Caucasus)
0.5 ± 0.1 < 0.1
3
Table 1. Hg concentrations in
gases using photolysis and pyrolysis, 10- 0 ghn· l
Main Regularities in the Distribution of Mercury-Bearing Gas
and Oil Deposits
Mercury content in oils and gases varies broadly (Table 2). We have fewer
analyses of condensates of hydrocarbon gases compared to those of oils and
Oil
Gas
< I X 10- 6 -2.1 x 10-"'%
I x 10- 8 g/mJ_ 14 mg/m"'
Table 2. Hg concentrations in oil
and gas deposi Is