

Distribution. Bioavailability and Speciation of Mercury
197
100000
x
X
10000
{j.
X
=:: 1000
CI
.:
GI
- «I 100
:::J
iii
. =
CI
10
:I:
•
•
{j.
f'~
x
• Topsoil
•
•
X
X
:x Xx
x Anthr. Fill
x
{j.
•
(j. X ) • • )(
l> Loess/Silt
...
......
4 i·~
•
~
• Gravel/Sand
1
•
•
x
0
....
10
100
1000
10000
100000
total Hg in soil (mglkg)
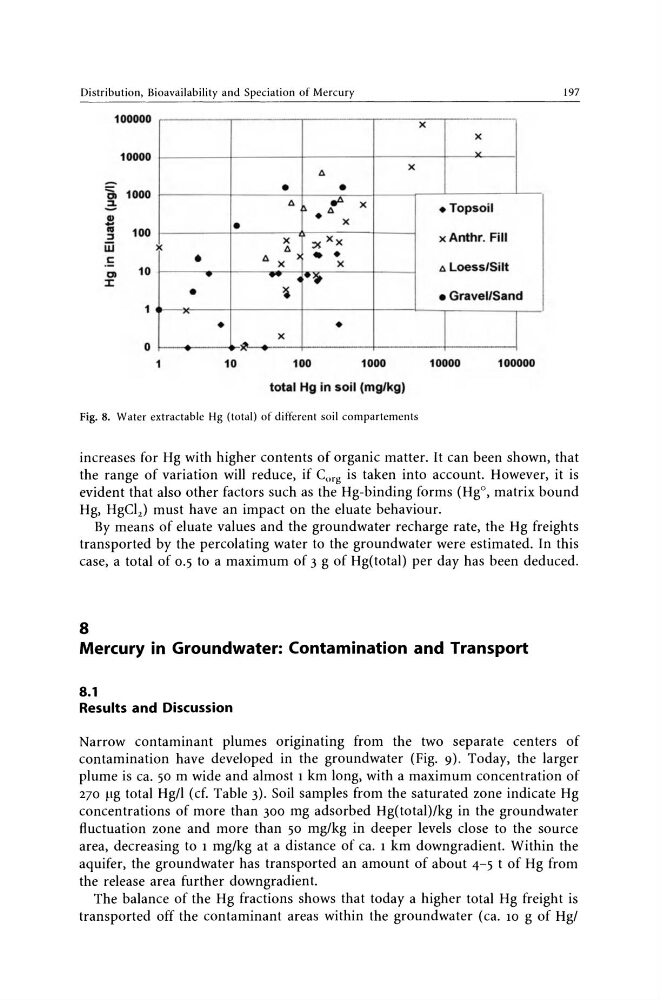
Fig. 8. Water extractable Hg (total) of different soil compartements
increases for Hg with higher contents of organic matter. It can been shown, that
the range of variation will reduce, if Corg is taken into account. However, it is
evident that also other factors such as the Hg-binding forms (HgO, matrix bound
Hg, HgCI2 ) must have an impact on the eluate behaviour.
By means of eluate values and the groundwater recharge rate, the Hg freights
transported by the percolating water to the groundwater were estimated. In this
case, a total of 0.5 to a maximum of 3 g of Hg(total) per day has been deduced.
8
Mercury in Groundwater: Contamination and Transport
8.1
Results and Discussion
Narrow contaminant plumes ongmating from the two separate centers of
contamination have developed in the groundwater (Fig. 9). Today, the larger
plume is ca. 50 m wide and almost 1 km long, with a maximum concentration of
270 pg total Hg/I (cf. Table 3). Soil samples from the saturated zone indicate Hg
concentrations of more than 300 mg adsorbed Hg(total)/kg in the groundwater
fluctuation zone and more than 50 mg/kg in deeper levels close to the source
area, decreasing to 1 mg/kg at a distance of ca. 1 km downgradient. Within the
aquifer, the groundwater has transported an amount of about 4-5 t of Hg from
the release area further downgradient.
The balance of the Hg fractions shows that today a higher total Hg freight is
transported off the contaminant areas within the groundwater (ca. 10 g of HgI
197
100000
x
X
10000
{j.
X
=:: 1000
CI
.:
GI
- «I 100
:::J
iii
. =
CI
10
:I:
•
•
{j.
f'~
x
• Topsoil
•
•
X
X
:x Xx
x Anthr. Fill
x
{j.
•
(j. X ) • • )(
l> Loess/Silt
...
......
4 i·~
•
~
• Gravel/Sand
1
•
•
x
0
....
10
100
1000
10000
100000
total Hg in soil (mglkg)
Fig. 8. Water extractable Hg (total) of different soil compartements
increases for Hg with higher contents of organic matter. It can been shown, that
the range of variation will reduce, if Corg is taken into account. However, it is
evident that also other factors such as the Hg-binding forms (HgO, matrix bound
Hg, HgCI2 ) must have an impact on the eluate behaviour.
By means of eluate values and the groundwater recharge rate, the Hg freights
transported by the percolating water to the groundwater were estimated. In this
case, a total of 0.5 to a maximum of 3 g of Hg(total) per day has been deduced.
8
Mercury in Groundwater: Contamination and Transport
8.1
Results and Discussion
Narrow contaminant plumes ongmating from the two separate centers of
contamination have developed in the groundwater (Fig. 9). Today, the larger
plume is ca. 50 m wide and almost 1 km long, with a maximum concentration of
270 pg total Hg/I (cf. Table 3). Soil samples from the saturated zone indicate Hg
concentrations of more than 300 mg adsorbed Hg(total)/kg in the groundwater
fluctuation zone and more than 50 mg/kg in deeper levels close to the source
area, decreasing to 1 mg/kg at a distance of ca. 1 km downgradient. Within the
aquifer, the groundwater has transported an amount of about 4-5 t of Hg from
the release area further downgradient.
The balance of the Hg fractions shows that today a higher total Hg freight is
transported off the contaminant areas within the groundwater (ca. 10 g of HgI