

132
A.B. Mukherjee
Raw materials used for energy production or in the metallurgical industry
contain trace amounts of Hg and other heavy metals. At higher temperatures, Hg
vaporizes and passes into the atmosphere in the gas phase. In addition, 50 2
released during the production of Cu, Ni, Zn and Pb, contains Hg which passes
into the H2S0 4 production line. The major part of this H2S0 4 is used for
production offertilizer and titanium dioxide (Ti02). Uses of H2S0 4 are also noted
in water-treatment plants and leaching of ores, thus Hg passes into soils, water,
and into the food chain. Due to the development of new technology, it is possible
to restrict and recover Hg from the metallurgical industry, as discussed below.
2
Mercury in Raw Materials
Hg in coal is mostly associated with minerals in the inorganic fraction.
Concentration of the elements in coal are on average equal to the average
concentrations in the earth's crust (Meij 1994). In nine European countries,
Swaine (1990) observed that the Hg content in coal burnt in utility boilers was
0.3 pg g-I. Occasionally, high concentrations of Hg (1.0 ~lg g-I) are reported. Hg
concentrations in coal vary from mine to mine. On the other hand, sulphide
concentrates contain on average 100-300 pg Hg g-I (Habashi 1992b). The
concentration ofHg in raw materials used in various facilities differs substantially,
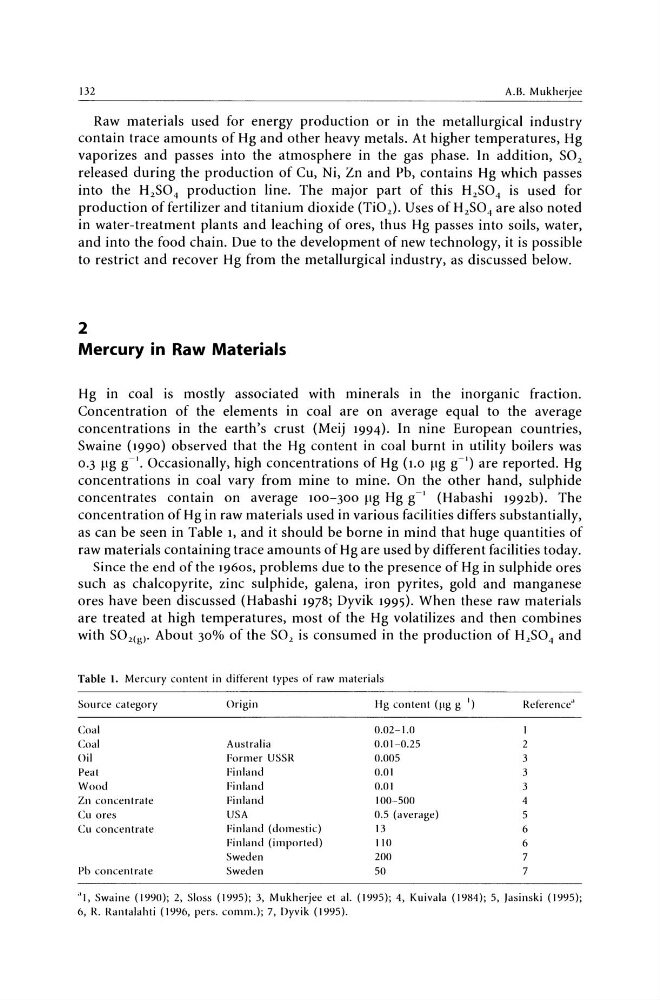
as can be seen in Table 1, and it should be borne in mind that huge quantities of
raw materials containing trace amounts ofHg are used by different facilities today.
Since the end of the 1960s, problems due to the presence of Hg in sulphide ores
such as chalcopyrite, zinc sulphide, galena, iron pyrites, gold and manganese
ores have been discussed (Habashi 1978; Dyvik 1995). When these raw materials
are treated at high temperatures, most of the Hg volatilizes and then combines
with S02(g)' About 30% of the 502 is consumed in the production of H2S0 4 and
Table l. Mercury content in different types of raw materials
Source category
Origin
Hg content (fig g I)
Reference"
Coal
0.02-1.0
Coal
Australia
0.01-0.25
2
Oil
Former USSR
0.005
3
Peat
Finland
0.01
3
Wood
Finland
0.01
3
Zn concentrate
Finland
100-500
4
Cu ores
USA
0.5 (average)
5
Cu concentrate
Finland (domestic)
13
6
Finland (imported)
110
6
Sweden
200
7
Pb concentrate
Sweden
50
7
"1, Swaine (1990); 2, Sloss (1995); 3, Mukherjee et al. (1995); 4, Kuivala (1984); 5, Jasinski (1995);
6, R. Rantalahti (1996, pers. comm.); 7, Dyvik (1995).
A.B. Mukherjee
Raw materials used for energy production or in the metallurgical industry
contain trace amounts of Hg and other heavy metals. At higher temperatures, Hg
vaporizes and passes into the atmosphere in the gas phase. In addition, 50 2
released during the production of Cu, Ni, Zn and Pb, contains Hg which passes
into the H2S0 4 production line. The major part of this H2S0 4 is used for
production offertilizer and titanium dioxide (Ti02). Uses of H2S0 4 are also noted
in water-treatment plants and leaching of ores, thus Hg passes into soils, water,
and into the food chain. Due to the development of new technology, it is possible
to restrict and recover Hg from the metallurgical industry, as discussed below.
2
Mercury in Raw Materials
Hg in coal is mostly associated with minerals in the inorganic fraction.
Concentration of the elements in coal are on average equal to the average
concentrations in the earth's crust (Meij 1994). In nine European countries,
Swaine (1990) observed that the Hg content in coal burnt in utility boilers was
0.3 pg g-I. Occasionally, high concentrations of Hg (1.0 ~lg g-I) are reported. Hg
concentrations in coal vary from mine to mine. On the other hand, sulphide
concentrates contain on average 100-300 pg Hg g-I (Habashi 1992b). The
concentration ofHg in raw materials used in various facilities differs substantially,
as can be seen in Table 1, and it should be borne in mind that huge quantities of
raw materials containing trace amounts ofHg are used by different facilities today.
Since the end of the 1960s, problems due to the presence of Hg in sulphide ores
such as chalcopyrite, zinc sulphide, galena, iron pyrites, gold and manganese
ores have been discussed (Habashi 1978; Dyvik 1995). When these raw materials
are treated at high temperatures, most of the Hg volatilizes and then combines
with S02(g)' About 30% of the 502 is consumed in the production of H2S0 4 and
Table l. Mercury content in different types of raw materials
Source category
Origin
Hg content (fig g I)
Reference"
Coal
0.02-1.0
Coal
Australia
0.01-0.25
2
Oil
Former USSR
0.005
3
Peat
Finland
0.01
3
Wood
Finland
0.01
3
Zn concentrate
Finland
100-500
4
Cu ores
USA
0.5 (average)
5
Cu concentrate
Finland (domestic)
13
6
Finland (imported)
110
6
Sweden
200
7
Pb concentrate
Sweden
50
7
"1, Swaine (1990); 2, Sloss (1995); 3, Mukherjee et al. (1995); 4, Kuivala (1984); 5, Jasinski (1995);
6, R. Rantalahti (1996, pers. comm.); 7, Dyvik (1995).