

Hg-Contaminated Industrial and Mining Sites in N. America
93
fish consumption advisory in August 1981. Intensive investigations and monitoring were undertaken jointly by the manufacturer and regulatory agencies.
Corrective actions undertaken by the manufacturer over the next decade
included (1) capture and treatment of Hg-contaminated groundwater (containing
up to 7 mg 1-'), (2) upgrade of industrial wastewater pretreatment system for
mercury process wastewaters, and (3) removal of Hg-contaminated soil
(> 5500 t) at the plant site. Production of mercuric oxide batteries was also
discontinued in 1992. Sediment coring in the more lacustrine portions of the
embayment demonstrated evidence of burial of previously high surface
concentrations under substantially cleaner sediments following actions at the
Lake St Clair Walleye
2.50
2.00
-----------------------------------------------------------------~ 1.50
--- ---------------------------------------------------------------Cl
-
~
~
:::I
o
Gi
::l!ii 1.00 --------- ----------------------------------------------------------0.50
0.00
1970
1975
1980
1985
Year
1990
1995
2000
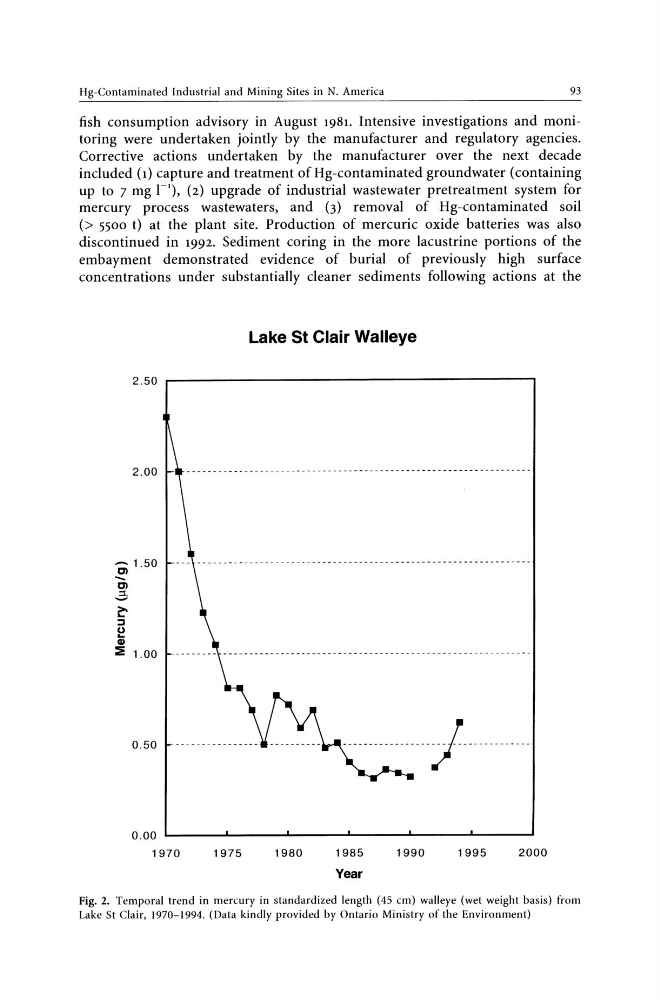
Fig. 2. Temporal trend in mercury in standardized length (45 cm) walleye (wet weight basis) from
Lake St Clair, 1970-1994. (Data kindly provided by Ontario Ministry of the Environment)
93
fish consumption advisory in August 1981. Intensive investigations and monitoring were undertaken jointly by the manufacturer and regulatory agencies.
Corrective actions undertaken by the manufacturer over the next decade
included (1) capture and treatment of Hg-contaminated groundwater (containing
up to 7 mg 1-'), (2) upgrade of industrial wastewater pretreatment system for
mercury process wastewaters, and (3) removal of Hg-contaminated soil
(> 5500 t) at the plant site. Production of mercuric oxide batteries was also
discontinued in 1992. Sediment coring in the more lacustrine portions of the
embayment demonstrated evidence of burial of previously high surface
concentrations under substantially cleaner sediments following actions at the
Lake St Clair Walleye
2.50
2.00
-----------------------------------------------------------------~ 1.50
--- ---------------------------------------------------------------Cl
-
~
~
:::I
o
Gi
::l!ii 1.00 --------- ----------------------------------------------------------0.50
0.00
1970
1975
1980
1985
Year
1990
1995
2000
Fig. 2. Temporal trend in mercury in standardized length (45 cm) walleye (wet weight basis) from
Lake St Clair, 1970-1994. (Data kindly provided by Ontario Ministry of the Environment)