

634
L.R.J. van Vuuren, J.W. Funke and L. Smith
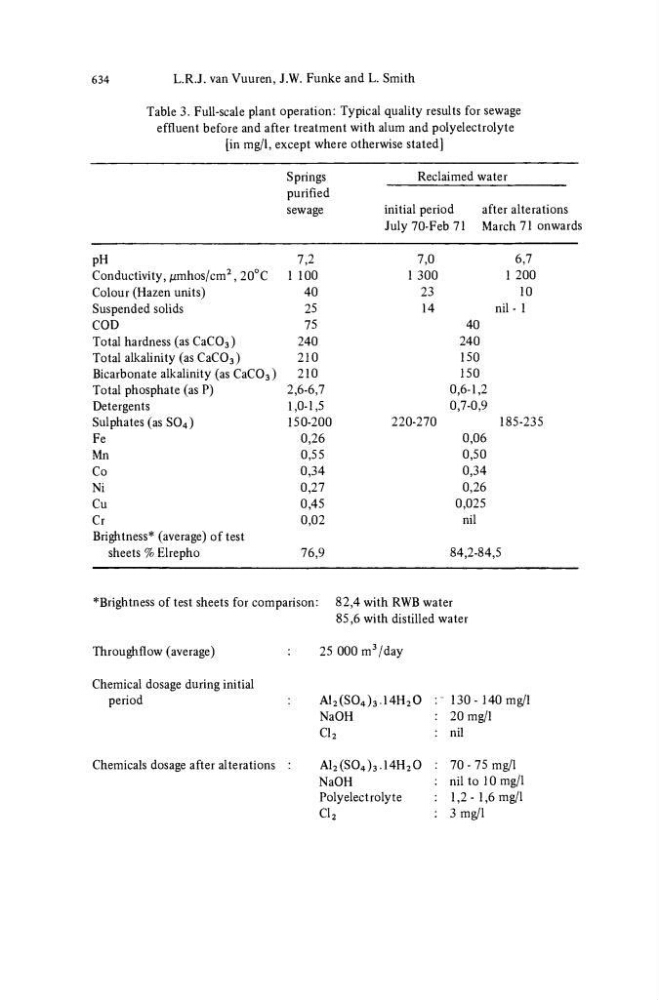
Table 3. Full-scale plant operation: Typical quality results for sewage
effluent before and after treatment with alum and polyelectrolyte
[in mg/1, except where otherwise stated]
PH
Conductivity, ^mhos/cm
2 ,20°C
Colour (Hazen units)
Suspended solids
COD
Total hardness (as CaC0 3 )
Total alkalinity (as CaC0 3 )
Bicarbonate alkalinity (as CaC0 3 )
Total phosphate (as P)
Detergents
Sulphates (as S0 4 )
Fe
Mn
Co
Ni
Cu
Cr
Brightness* (average) of test
sheets % Elrepho
Springs
purified
sewage
7,2
1 100
40
25
75
240
210
210
2,6-6,7
1,0-1,5
150-200
0,26
0,55
0,34
0,27
0,45
0,02
76,9
Reclaimed water
initial period
after alterations
July 70-Feb 71 March 71 onwards
7,0
1 300
23
14
220-270
6,7
1 200
10
nil- 1
40
240
150
150
0,6-1,2
0,7-0,9
185-235
0,06
0,50
0,34
0,26
0,025
nil
84,2-84,5
^Brightness of test sheets for comparison: 82,4 with RWB water
85,6 with distilled water
Throughflow (average)
:
Chemical dosage during initial
period
:
Chemicals dosage after alterations :
25 000 m
3 /day
A1 2 (S0 4 ) 3 14H 2 0
NaOH
Cl 2
A1 2 (S0 4 ) 3 .14H 2 0
NaOH
Polyelectrolyte
ci 2
~ 130- 140 mg/1
20 mg/1
nil
70 - 75 mg/1
nil to 10 mg/1
1,2-1,6 mg/1
3 mg/1