

586
A.K. Basu and Edmond Leclerc
T
*
A.„ _
V. acids
/
· \
/
Alkalinity
Days
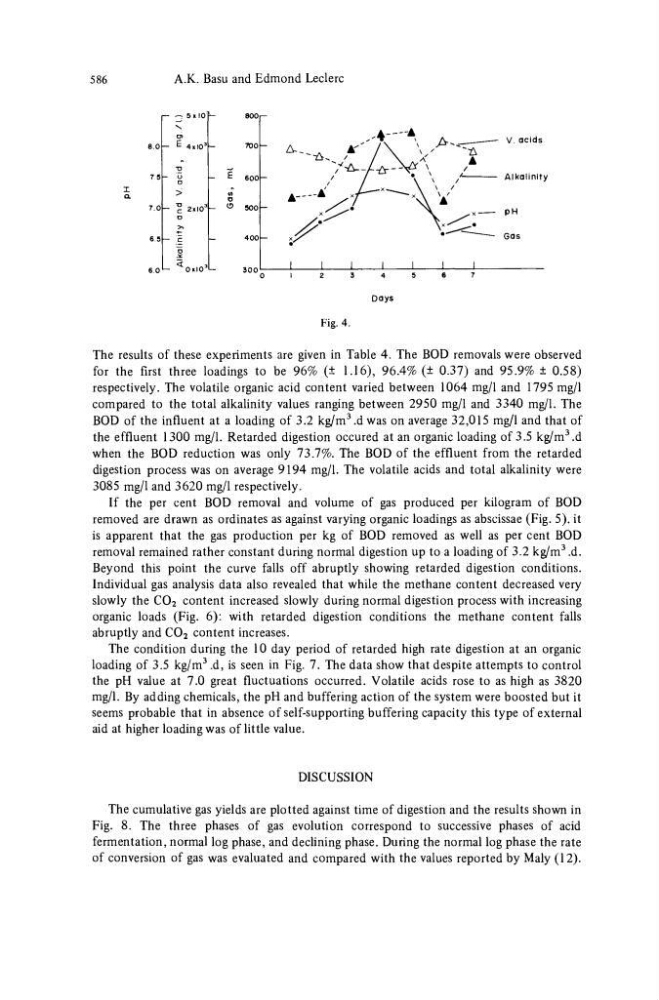
Fig. 4.
The results of these experiments are given in Table 4. The BOD removals were observed
for the first three loadings to be 96% (± 1.16), 96.4% (± 0.37) and 95.9% ± 0.58)
respectively. The volatile organic acid content varied between 1064 mg/1 and 1795 mg/1
compared to the total alkalinity values ranging between 2950 mg/1 and 3340 mg/1. The
BOD of the influent at a loading of 3.2 kg/m
3 .d was on average 32,015 mg/1 and that of
the effluent 1300 mg/1. Retarded digestion occured at an organic loading of 3.5 kg/m
3 .d
when the BOD reduction was only 73.7%. The BOD of the effluent from the retarded
digestion process was on average 9194 mg/1. The volatile acids and total alkalinity were
3085 mg/1 and 3620 mg/1 respectively.
If the per cent BOD removal and volume of gas produced per kilogram of BOD
removed are drawn as ordinates as against varying organic loadings as abscissae (Fig. 5). it
is apparent that the gas production per kg of BOD removed as well as per cent BOD
removal remained rather constant during normal digestion up to a loading of 3.2 kg/m
3 .d.
Beyond this point the curve falls off abruptly showing retarded digestion conditions.
Individual gas analysis data also revealed that while the methane content decreased very
slowly the C0 2 content increased slowly during normal digestion process with increasing
organic loads (Fig. 6): with retarded digestion conditions the methane content falls
abruptly and C0 2 content increases.
The condition during the 10 day period of retarded high rate digestion at an organic
loading of 3.5 kg/m
3 .d, is seen in Fig. 7. The data show that despite attempts to control
the pH value at 7.0 great fluctuations occurred. Volatile acids rose to as high as 3820
mg/1. By adding chemicals, the pH and buffering action of the system were boosted but it
seems probable that in absence of self-supporting buffering capacity this type of external
aid at higher loading was of little value.
DISCUSSION
The cumulative gas yields are plotted against time of digestion and the results shown in
Fig. 8. The three phases of gas evolution correspond to successive phases of acid
fermentation, normal log phase, and declining phase. During the normal log phase the rate
of conversion of gas was evaluated and compared with the values reported by Maly (12).
A.K. Basu and Edmond Leclerc
T
*
A.„ _
V. acids
/
· \
/
Alkalinity
Days
Fig. 4.
The results of these experiments are given in Table 4. The BOD removals were observed
for the first three loadings to be 96% (± 1.16), 96.4% (± 0.37) and 95.9% ± 0.58)
respectively. The volatile organic acid content varied between 1064 mg/1 and 1795 mg/1
compared to the total alkalinity values ranging between 2950 mg/1 and 3340 mg/1. The
BOD of the influent at a loading of 3.2 kg/m
3 .d was on average 32,015 mg/1 and that of
the effluent 1300 mg/1. Retarded digestion occured at an organic loading of 3.5 kg/m
3 .d
when the BOD reduction was only 73.7%. The BOD of the effluent from the retarded
digestion process was on average 9194 mg/1. The volatile acids and total alkalinity were
3085 mg/1 and 3620 mg/1 respectively.
If the per cent BOD removal and volume of gas produced per kilogram of BOD
removed are drawn as ordinates as against varying organic loadings as abscissae (Fig. 5). it
is apparent that the gas production per kg of BOD removed as well as per cent BOD
removal remained rather constant during normal digestion up to a loading of 3.2 kg/m
3 .d.
Beyond this point the curve falls off abruptly showing retarded digestion conditions.
Individual gas analysis data also revealed that while the methane content decreased very
slowly the C0 2 content increased slowly during normal digestion process with increasing
organic loads (Fig. 6): with retarded digestion conditions the methane content falls
abruptly and C0 2 content increases.
The condition during the 10 day period of retarded high rate digestion at an organic
loading of 3.5 kg/m
3 .d, is seen in Fig. 7. The data show that despite attempts to control
the pH value at 7.0 great fluctuations occurred. Volatile acids rose to as high as 3820
mg/1. By adding chemicals, the pH and buffering action of the system were boosted but it
seems probable that in absence of self-supporting buffering capacity this type of external
aid at higher loading was of little value.
DISCUSSION
The cumulative gas yields are plotted against time of digestion and the results shown in
Fig. 8. The three phases of gas evolution correspond to successive phases of acid
fermentation, normal log phase, and declining phase. During the normal log phase the rate
of conversion of gas was evaluated and compared with the values reported by Maly (12).