

Cost Relationship of Biological and Thermal Processes
539
Wastewater ranging from 1000 to 10000 mg BOD 5 /l was examined and it was found
that the degree of BOD reduction is practically unaffected by the wastewater
concentration. It was also found that prior partial purification in a trickling filter did not
have a detrimental effect on the performance of the aeration stage.
Curves 1 (plastic trickling filter), 2 (activated sludge system) and 3 (high-rate activated
sludge system) were used as a basis for rating the plants.
Assumptions
The costs*per kg of BOD reduction were used to compare the different processes. In
the main, the costs are composed of capital expenditure and power costs. Personnel costs
were not taken into consideration. It is assumed that the amount of excess sludge
obtained in the various processes is of the same order of magnitude. This means that
sludge treatment need not be included in the cost considerations. Although this
assumption is not absolutely correct, it is necessary in order to limit the number of
variables for the sake of clarity.
The capital expenditure for the aeration unit is determined in relation to basin volume,
depth and shape, (Fig. 2) the trickling filter costs as a function of volume and filter height
(Fig. 3).
The same factors were used for costing machinery and off-sites; in addition, the
oxygen demand was considered in the case of the activated sludge process. A
height/diameter ratio of 0.5 : 1 was laid down for sizing the trickling filters.
The capital expenditure was based on the cost factors currently prevailing in the
Federal Republic of Germany. The investment-bound costs such as depreciation, interest,
taxes and maintenance were assumed to be 17% of the capital expenditure per annum.
Power was assumed to cost 0.05 DM/kWh and thermal energy 0.01 DM/Mcal.
Cost comparison of the activated sludge and trickling filter processes
When using the single-stage activated sludge or trickling filter process for wastewater
treatment, the specific BOD reduction costs are determined by
C s
= f (
F '
C B O D 5 " >
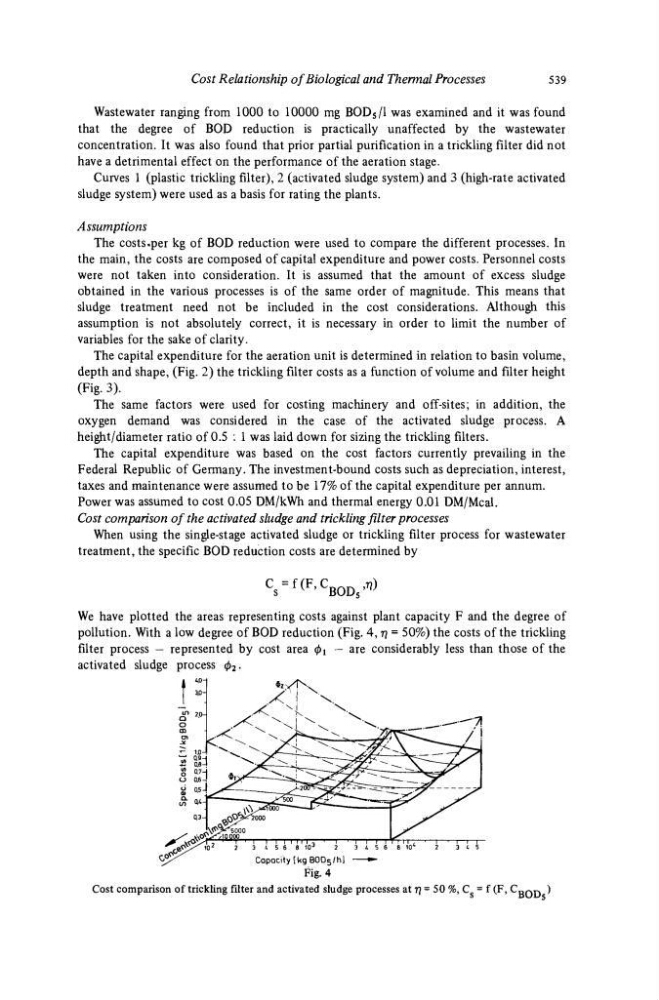
We have plotted the areas representing costs against plant capacity F and the degree of
pollution. With a low degree of BOD reduction (Fig. 4, η = 50%) the costs of the trickling
filter process — represented by cost area φ χ — are considerably less than those of the
activated sludge process φ 2 .
Fig. 4
Cost comparison of trickling filter and activated sludge processes at η = 50 %, C = f (F, C fi Q D )
539
Wastewater ranging from 1000 to 10000 mg BOD 5 /l was examined and it was found
that the degree of BOD reduction is practically unaffected by the wastewater
concentration. It was also found that prior partial purification in a trickling filter did not
have a detrimental effect on the performance of the aeration stage.
Curves 1 (plastic trickling filter), 2 (activated sludge system) and 3 (high-rate activated
sludge system) were used as a basis for rating the plants.
Assumptions
The costs*per kg of BOD reduction were used to compare the different processes. In
the main, the costs are composed of capital expenditure and power costs. Personnel costs
were not taken into consideration. It is assumed that the amount of excess sludge
obtained in the various processes is of the same order of magnitude. This means that
sludge treatment need not be included in the cost considerations. Although this
assumption is not absolutely correct, it is necessary in order to limit the number of
variables for the sake of clarity.
The capital expenditure for the aeration unit is determined in relation to basin volume,
depth and shape, (Fig. 2) the trickling filter costs as a function of volume and filter height
(Fig. 3).
The same factors were used for costing machinery and off-sites; in addition, the
oxygen demand was considered in the case of the activated sludge process. A
height/diameter ratio of 0.5 : 1 was laid down for sizing the trickling filters.
The capital expenditure was based on the cost factors currently prevailing in the
Federal Republic of Germany. The investment-bound costs such as depreciation, interest,
taxes and maintenance were assumed to be 17% of the capital expenditure per annum.
Power was assumed to cost 0.05 DM/kWh and thermal energy 0.01 DM/Mcal.
Cost comparison of the activated sludge and trickling filter processes
When using the single-stage activated sludge or trickling filter process for wastewater
treatment, the specific BOD reduction costs are determined by
C s
= f (
F '
C B O D 5 " >
We have plotted the areas representing costs against plant capacity F and the degree of
pollution. With a low degree of BOD reduction (Fig. 4, η = 50%) the costs of the trickling
filter process — represented by cost area φ χ — are considerably less than those of the
activated sludge process φ 2 .
Fig. 4
Cost comparison of trickling filter and activated sludge processes at η = 50 %, C = f (F, C fi Q D )